Datametri Logo
01
Internal Consistency and Item Sensitivity Analysis (Alpha if Item Deleted)
Cronbach's Alpha Internal Consistency
"Test the Resistance of the Measurement Instrument Against Random Errors"

The first step of measurement quality is to determine the marginal effect of the items on total internal consistency. This analysis evaluates the degree to which test items synchronously measure the same latent construct.

Which Questions Does This Analysis Answer?
  • How harmoniously do the items in my scale work together to measure a single concept (unidimensionality)?
  • If we want to shorten the scale (create a short form), sacrificing which items will minimize the loss of reliability?
Added Value to Your Research

In corporate performance or clinical survey systems, identifying "unnecessary" or "misunderstood" questions that cause respondent fatigue reduces data collection costs while maximizing response quality.

Item Sensitivity Analysis
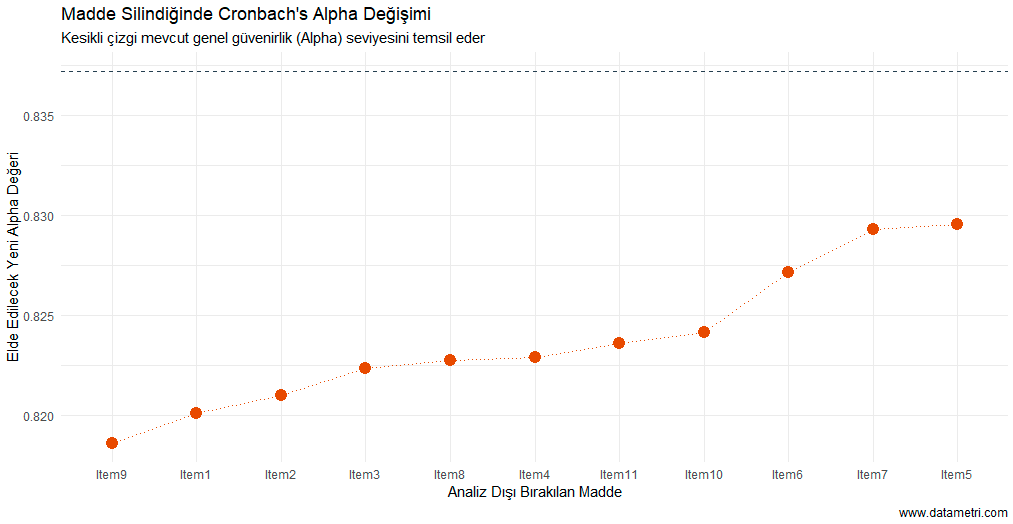
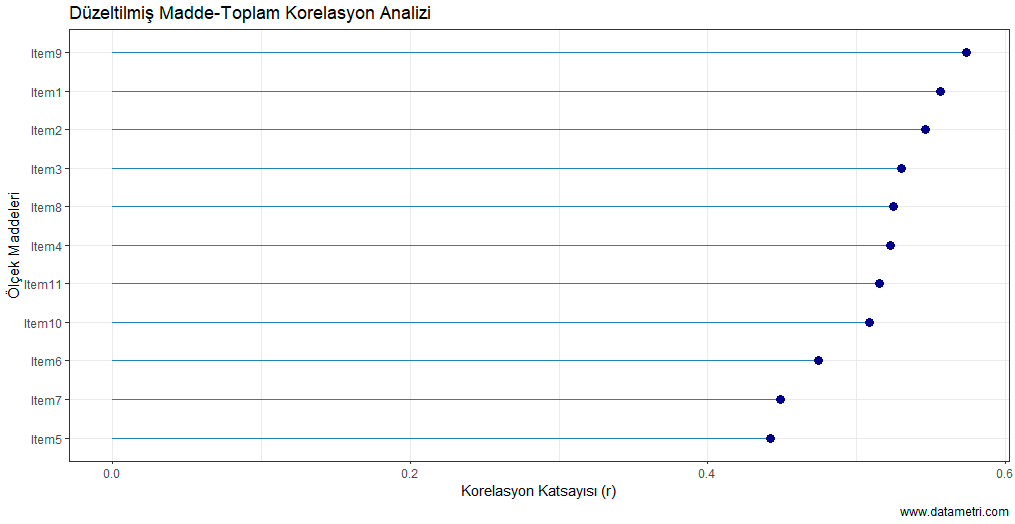
Each data point in the graph shows the new Cronbach's Alpha coefficient produced by the remaining items when the respective item is removed from the scale. The dashed line represents the current overall reliability level. According to the analysis result, the total reliability dropping to its lowest level (0.818) when Item9 is excluded proves that this item is the "core component" of the scale.
02
Corrected Item-Total Correlation Analysis
Discrimination r.drop
"Measure the Individual Discrimination Power of the Items"

By determining the discrimination power of the items and their relationship with the total scale score, we quantitatively measure the individual psychometric performance of each question.

Which Questions Does This Analysis Answer?
  • Are the questions in the scale sharp enough to distinguish individual differences (variance) among participants?
  • Which items show the highest linear alignment with the main theoretical concept intended to be measured?
Added Value to Your Research

Items with high discrimination power are, for example, in a customer loyalty model, the key questions capable of distinguishing true loyal customers from those who only appear loyal. This directly increases the precision rate of target audience segmentation.

Corrected Item-Total Correlation
This graph displays the corrected correlation coefficient (r.drop) between each item's own score and the total score of the scale. It is proven that all items have a discrimination performance above the 0.30 threshold value in academic literature (Nunnally, 1978).
03
Exploratory Factor Analysis (EFA): Construct Discovery and Dimension Reduction
EFA Dimension Reduction
"Reduce Complex Data Piles into Manageable Strategic Themes"

Exploratory Factor Analysis is not only an exploratory method that tests how items empirically cluster under theoretically expected sub-dimensions, but also a very powerful data reduction technique.

Which Questions Does This Analysis Answer?
  • How many distinct sub-dimensions (themes) does the data collection tool I prepared actually represent?
  • Are there overlapping or problematic items that load highly (cross-loading) onto multiple factors simultaneously?
Added Value to Your Research

Instead of an exhausting survey set with dozens of highly correlated questions, it reduces the analysis to clear dimensions such as "Leadership, Burnout, Motivation". This proves which specific theme requires operational action.

Exploratory Factor Analysis Output
As a result of the 3-factor solution obtained using Maximum Likelihood (ML) estimation and Oblimin rotation; it is seen that the items exhibit a perfect empirical overlap with their theoretical structure. The fact that the factor loadings are above the 0.45 threshold line is the first solid evidence of the scale's construct validity.
04
Confirmatory Factor Analysis (CFA) and Measurement Model Validation
CFA Structural Equation (SEM)
"Certify Your Measurement Instrument at International Standards (APA)"

How well the discovered factor structure (EFA) fits the collected raw data is confirmed by Confirmatory Factor Analysis (CFA) via strict statistical Fit Indices.

Which Questions Does This Analysis Answer?
  • Is the multidimensional structure I theoretically proposed statistically verified (model fit) with the collected data?
  • Do the overall fit indices of the model (CFI, TLI, RMSEA) meet the publication standards of high-impact academic journals (APA, AERA)?
Added Value to Your Research

CFA is the scientific certificate of corporate analytical models. It indisputably proves that the measurement reports presented to the board of directors or academic juries are not coincidental, and that the "Construct Validity" of the independent variables is certified.

Confirmatory Factor Analysis Path Diagram
In this hierarchical Path Diagram, the latent dimensions (Dimension_1, 2, 3) form the theoretical core of the model. The robust fit indices (CFI = 1.000, RMSEA = 0.004) mathematically prove that the model is within the "perfect fit" range.
05
Convergent and Discriminant Validity (AVE & CR / Fornell-Larcker Criterion)
Convergent Validity Discriminant Validity

Beyond the factor loadings obtained as a result of Confirmatory Factor Analysis (CFA), these are advanced construct validity proofs that test whether each dimension of the model shares adequate variance with its own items (Convergent Validity) and how statistically independent it is from other dimensions (Discriminant Validity).

A. Convergent Validity: Average Variance Extracted (AVE) and Composite Reliability (CR)

Dimension (Latent Variable) AVE (Average Variance Extracted) CR (Composite Reliability)
Dimension_10.6640.888
Dimension_20.6350.839
Dimension_30.6290.871

Analyzing the table, it is seen that the AVE values in all dimensions are above the 0.50 academic threshold and CR values are above 0.70. This confirms that the items represent the relevant dimension without error.

B. Discriminant Validity: Fornell-Larcker Criterion

Dimension Dimension_1 Dimension_2 Dimension_3
Dimension_10.815
Dimension_20.2930.797
Dimension_30.3070.3250.793

According to the Fornell-Larcker criterion; the fact that the square root of the AVE value of each dimension (e.g., Dimension_1: 0.815) is significantly higher than its bivariate correlation coefficients with other constructs proves that the dimensions in the model do not conceptually overlap.

What Could Be the Added Value to the Researcher?

Prevents conceptual (semantic overlap of concepts) redundancy. You ensure that an investment made in one area does not artificially affect another measurement. In academic research, this rigorous reporting directly refutes "Multicollinearity" criticisms from reviewers in high-impact (Q1) journals.

06
Measurement Invariance Analysis (MGCFA)
Invariance Testing MGCFA
"Does Your Scale Measure the Same Concept Across Different Groups (Male/Female, Different Cultures)?"

It is a mandatory validity step prior to inter-group mean comparisons (ANOVA, t-test) that tests whether a scale means the same thing across different demographic or experimental groups.

Table: Hierarchical Model Comparisons (LRT)

Model (Stage) χ² df AIC BIC Δχ² Δdf RMSEA p
1. Configural (Structural)83.44821535715674----
2. Metric (Weak)97.449015355156371480.050.082
3. Scalar (Strong)106.829815349155959.3780.0240.312

Examining the Hierarchical Invariance Test (Likelihood Ratio Test) results; it is seen that the p-values of the chi-square difference tests between configural, metric, and scalar models are not significant (p > 0.05), and the RMSEA differences remain below the threshold values (e.g., p = 0.312 for fit_scalar). This finding confirms that the structural form and factor loadings of the scale are "invariant" for both demographic groups.

What Could Be the Added Value to the Researcher?

Provides a methodological armor for performance comparisons you make between different cultures or segments. It proves that your comparisons sit on a fair and scientific basis, and that you are not comparing "apples with oranges".

07
Confirmatory Factor Analysis for Ordinal Data (WLSMV & Polychoric)
WLSMV Estimator Polychoric Correlation
"Models That Respect the Discontinuous Nature of Likert Scales"

Likert-type scales (1-Strongly Disagree, 5-Strongly Agree) frequently used in social sciences and medicine are by their nature ordinal data structures, not continuous. The traditional Maximum Likelihood (ML) estimator assumes the data is multivariate normally distributed. The use of ML on skewed Likert data where this assumption is violated leads to artificially low factor loadings (attenuation bias).

To eliminate this methodological weakness, we apply the WLSMV (Diagonally Weighted Least Squares) estimator based on the asymptotic variance-covariance matrix and Polychoric Correlations. This approach produces the most accurate parameters by modeling not the items themselves, but the "latent response distribution" underlying those items.

Table: Robust Model Fit Indices for Ordinal Data

Fit Index Value 95% Confidence Interval / Significance Criterion
Scaled χ² / df39.236 / 41p = .549p > .05 (Perfect)
Robust CFI1.000-> .95
Robust RMSEA0.00290% CI [0.000, 0.038]< .05

As seen in the table, by stretching the continuous data assumption, the Chi-square (χ²) value attained statistical non-significance (p = .549), capturing a perfect fit between the data and the model.

What Are the Benefits to Your Research?
  • Elimination of Type-I and Type-II Errors: Most survey data possesses an asymmetrical nature (ceiling/floor effect). The WLSMV algorithm accepts the data as it is without rebelling against its nature.
  • Level of Academic Evidence: Journals in the Q1 segment no longer accept the analysis of ordinal data with Pearson correlations (ML) as valid. This reporting format directly averts rejection based on "Methodological Flaw."
08
Item Response Theory (IRT)
IRT Information Function
"Measure the Information Value of Items by Applying 'Micro-Surgery' to Your Scale"

Surpassing the limitations of classical test theory (CTT), this is an advanced psychometric analysis that models the relationship of each item in the scale with the targeted latent trait using logarithmic functions. This method independently evaluates not only the test as a whole but the discrimination power of each individual question.

Which Questions Does This Analysis Answer?
  • Which items in my current scale are only contributing measurement error (noise) to the test?
  • Does my scale measure more sensitively those who are very low or very high on the trait (e.g., attitude or clinical depression)?
  • For participants to transition from "Disagree" to "Undecided," how much mathematical increase (theta) must occur in their internal attitude?
Added Value to the Researcher

By identifying items providing low information to the test with mathematical evidence and removing them from the scale, survey time can be radically shortened without compromising measurement reliability. This strategic optimization prevents response fatigue and certifies construct validity at the highest level.

Item Characteristic Curves (ICC)
Test Information Function (TIF)
The Item Characteristic Curves (ICC) obtained with the Graded Response Model show that the thresholds create smooth probability peaks across the attitude spectrum without blending into each other. Examining the Test Information Function (TIF) (Bottom Graph), it is determined that the maximum information and minimum measurement error (Standard Error) provided by the test occur between slightly below and slightly above the average (Theta: -2.5 to +1.2), and it is insufficient in measuring extreme outliers.
09
Full Structural Equation Modeling (SEM)
Full SEM Mediation
"Build Smooth Causal Networks Free from Error Variance"

Positioned at the pinnacle of the analytical flow, SEM is an advanced modeling technique that simultaneously tests direct and indirect causal relationships among measurement error-free latent dimensions within a single variance-covariance matrix. It eradicates the Type I error vulnerabilities (Alpha inflation) of the traditional Baron & Kenny stepwise regression method.

Which Questions Does This Analysis Answer?
  • While the independent variable exerts an effect on the dependent variable, through which "mediating mechanism" (Mediation) is this effect transferred?
  • To what degree (R²) do the factors I measured independently of each other simultaneously explain my ultimate target variable?
What Could Be the Added Value to the Researcher?

SEM analysis rescues strategic decision-making processes from intuitive guesses, turning them into causal projections. The significance of the Mediation effect (Indirect Effect) is reported with unshakeable scientific grounding (95% CI) obtained by resampling the dataset thousands of times (Bootstrap resampling).

Full Structural Equation Modeling Path Diagram
In this structural diagram (Path Diagram), the measurement model is integrated with the structural model. The arrows pointing to the target variable "Dimension_3" display the standardized path coefficients (beta). Dimension_1 (β = 0.23) and Dimension_2 (β = 0.26) are positive predictors of the ultimate target. The model successfully explains 15.5% (R²) of the total variance in the target variable.

Let's Introduce Your Measurement Instrument to Scientific Literature

Share your survey or clinical test data with us; let's collaboratively report the validity and reliability analyses (EFA, CFA, IRT) at the highest academic standards.