Datametri Logo
01
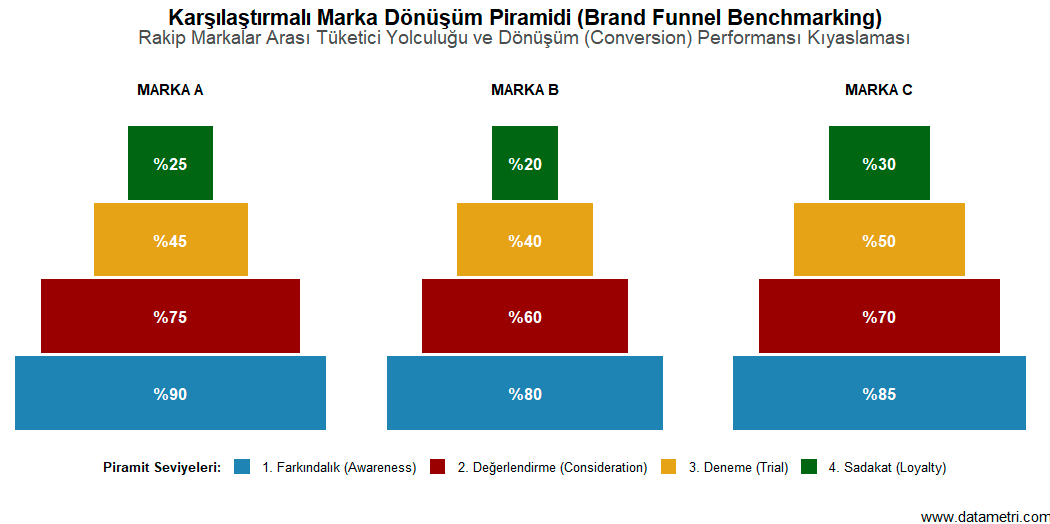
Dynamic Brand Funnel (Brand Funnel & Leakage)
Brand Funnel Leakage Analysis
"Identify the Critical Breaking Points in the Consumer Journey"

Measuring the Customer Journey at a macro level is the cornerstone of brand health research. This analysis maps the conversion rates of the target audience with a dynamic funnel architecture, extending from the "Unaided Awareness" stage to the final "Regular Use" (Loyalty) threshold.

Instead of merely listing static penetration rates, algorithmically calculating inter-stage conversion losses (leakages) allows us to identify exactly at which psychological or behavioral threshold (bottleneck) consumers are being lost.

Which Questions Does This Analysis Answer?
  • "Even though our brand awareness is high, at exactly which psychological/behavioral threshold are we losing consumers as we try to move them to the trial or loyalty stage?"
What Could Be the Added Value to Your Business?
  • By mathematically diagnosing the weak link of the marketing funnel; it ensures a data-driven resource allocation regarding whether the budget should be transferred to general brand communication (awareness building) or directly to field promotions (triggering trial).
Dynamic Brand Funnel and Leakage
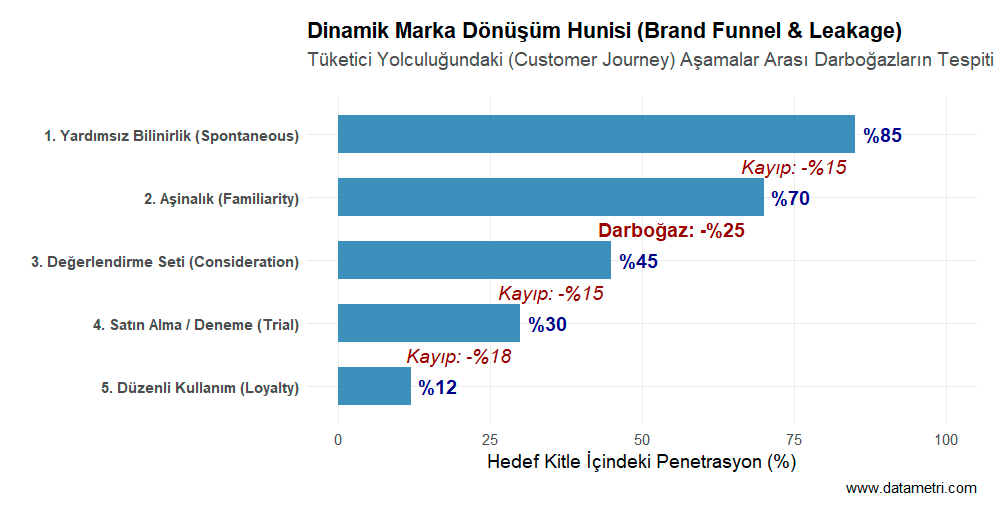
The most critical breaking points in the consumer flow are visualized by indicating drop-offs between stages with negative (-) values and emphasizing statistical bottlenecks.
02
Comparative Brand Conversion Pyramid (Benchmarking Funnel)
Benchmarking Conversion Pyramid
"Collide Your Competitive Conversion Power With Your Rivals"

Brand health metrics only gain meaning within the context of the current competitive set. This model provides a comparative benchmarking opportunity by colliding the consumer journey performances of main competitors on a single vector plane.

Which Questions Does This Analysis Answer?
  • "Compared to our main competitor, even though we are equal in terms of gaining a place in the consumer's mind (Awareness), how proportionally different is our power to convince them to try the product?"
And What is the Main Benefit It Provides?

It reveals in which consumer phase competitive advantage and disadvantage lie hidden. It provides strategic intelligence for developing aggressive marketing strategies (penetration strategies) aimed at the conversion stages where competitors are weak.

Comparative Brand Conversion Pyramid
Symmetrical bars mathematically centered on the origin (zero point) in a pyramid shape allow for a more intuitive visual perception of the performance differences of various brands at the same stage.
03
Importance-Performance Analysis (IPA Matrix)
IPA Matrix Derived Importance
"Reject Artificial Statements: Discover the True Drivers"

In literature, asking consumers "Which feature is important to you?" generally results in a ceiling effect where all variables are marked as "very important". The IPA matrix rejects these artificial stated importance levels and instead uses the statistically derived importance of image statements based on a dependent variable (loyalty).

Which Questions Does This Analysis Answer?
  • "Which are the attributes where we are currently very successful in the eyes of the consumer, but which actually contribute nothing to brand loyalty (Overkill / Unnecessary Investment)?"
  • "What are our blind spots where our performance remains low even though they directly affect consumer loyalty (Concentrate Here / Urgent Action)?"
What Could Be the Added Value to Your Brand?
  • Maximizes Return on Investment (ROI) by ensuring that R&D, product development, and corporate communication departments focus on operational areas that have the highest marginal contribution to consumer attitude (NPS/Loyalty).
Importance-Performance Matrix (IPA)
The vertical axis shows the degree to which an image statement predicts loyalty (derived importance), while the horizontal axis shows the brand's current market performance on that statement. The four quadrants created by the median break points mathematically assign variables to the statuses of "Concentrate Here", "Keep up the Good Work", "Possible Overkill", and "Low Priority".
04
NPS Key Drivers Regression
NPS Drivers Shapley Value
"Isolate the Actual Key Drivers Triggering Customer Loyalty"

Net Promoter Score (NPS) or Customer Satisfaction alone is a lagging indicator. The true academic value is in measuring the effect of the leading variables that shape this outcome. This analysis utilizes advanced Relative Weights (Shapley Value) regression, overcoming the multicollinearity problem frequently encountered in attitude research.

Which Questions Does This Analysis Answer?
  • "Is the root cause that mathematically triggers our customers' intention to recommend our brand to others (NPS) the most 'Price', or is it 'Seamless Usage Experience'?"
What Could Be the Added Value to Your Brand?
  • Instead of making random improvements to increase the institution's NPS score, it ensures that specific action plans are built upon the most heavily weighted driver pointed out by the regression model, and that board KPIs are revised according to these weights.
NPS Driver Regression Lollipop Chart
The model isolates the net statistical contribution margins of the independent variables that explain the variance of the dependent variable (NPS). The Lollipop chart reveals the effect sizes by presenting a strict hierarchy from the strongest "driver" variable to the weakest.
05
Brand Loyalty Model (CBBE / PLS-SEM)
PLS-SEM CBBE Model
"Map the Latent Constructs and Causal Networks Forming Brand Equity"

It is the econometric counterpart of Keller's Customer-Based Brand Equity (CBBE) pyramid. It shows how latent constructs like "Awareness", "Perceived Quality", and "Brand Image"—which cannot be measured by a single survey question—model the final "Purchase Intent" and "Loyalty".

Partial Least Squares Structural Equation Modeling (PLS-SEM) simultaneously draws the factor loadings (lambda) and structural causality paths (beta) between measurement statements and the Latent Variables they feed. Fit indices prove that the model theoretically fits the data perfectly.

Which Questions Does This Analysis Answer?
  • "With what intensity does an increase in brand awareness indirectly affect perceived quality? Do our image components (Modernity, Reliability) trigger purchase intent directly, or indirectly via quality perception (mediating effect)?"
What Could Be the Added Value to Your Brand?

Provides brand managers with a diagnostic tool showing with what mathematical probability and through which causal path an investment made in any component in the marketing ecosystem (like Image) will affect the financial output (Purchase/Loyalty) at the other end of the system.

CBBE Brand Loyalty Model (PLS-SEM)
The structural diagram in the visual displays the multifaceted causal network between abstract psychometric constructs like Brand Awareness, Perceived Quality, and Image, and the survey questions. The values on the arrows represent standardized regression coefficients (beta).
06
Brand Image Profile (Semantic Differential)
Semantic Differential Bipolar Profile
"Discover the Perceptual Gaps Between You and Your Competitors"

Brand positioning in the consumer's mind is often shaped via binary oppositions. Based on Osgood's psychometric scaling theory, Semantic Differential analysis tests the brand's perceptual elasticity within a space of bipolar adjectives (e.g., Traditional vs. Modern).

Which Questions Does This Analysis Answer?
  • Compared to our main competitor, on which opposing dimensions (like being Economical vs. Premium) does our brand identity exhibit a more distinct character? In which areas do we position ourselves mentally at the exact same point as our competitor?
What Could Be the Added Value to Your Brand?

It is used to determine the brand's Tone of Voice in corporate communication and advertising strategies. It provides a clear map of how the perceptual gaps between the brand and the competitor will be filled with communication campaigns.

Semantic Differential Brand Profile
The graph maps the mental footprints of your brand and your main competitor on a continuous perception scale. The breaking points and median axis intersections show the intensity of perceptual differentiation between brands.
07
Multiple Correspondence Analysis (MCA) and Perceptual Space
MCA Biplot Perceptual Space
"Matching Brands and Image Adjectives in the Same Space"

Traditional image analyses destroy data depth by merely aggregating consumer responses. Multiple Correspondence Analysis (MCA) simultaneously processes thousands of raw respondent rows in "Pick-Any" (Multiple Response) datasets to reveal the hidden relational geometry between brands and image adjectives. It does not stop at merely scattering points; the mental territory of each brand is drawn with "Multivariate Normal Ellipses".

Which Questions Does This Analysis Answer?
  • Which 'image cloud' has our brand clearly isolated in the consumer's mind, where competitors cannot enter? Which competitors do we share the same mental space (intersection set) with, stealing from each other's market share?
What Could Be the Added Value?

In re-positioning decisions, it enables finding perceptual gaps (white spaces) in the market. It statistically proves that competitors located within the same ellipse are the most dangerous substitute threats.

Correspondence Analysis (MCA) Perceptual Space
In the Correspondence Analysis (Biplot) graph, brands (squares) and image adjectives (dots) are located together. The spatial proximity of Brand "X" to the "Innovative" adjective is proof that in the consumer's mind, that brand is inextricably paired (statistically significant co-occurrence) with this adjective.
08
Image Ownership: Standardized Residuals
Z-Scores Halo-Free Image
"A Pure Image X-Ray Free from the 'Big Brand' Fallacy (Halo Effect)"

The "Big Brand Fallacy" (Size Bias/Halo Effect) is the situation where market leaders score artificially high on all positive image statements (Leader, Reliable, Innovative, etc.) simply because their awareness is high. This model eliminates market share asymmetry via Chi-Square ($\chi^2$) analysis.

Which Questions Does This Analysis Answer?
  • Even if we are not the market leader, which specific images do we own statistically far beyond the market average (at a significant level) relative to our own volume, becoming synonymous with our name?
What Could Be the Added Value to Your Brand?

Prevents erroneous strategies guided by misleading frequency tables. By revealing the true DNA of the brand, it proves the "True (Pure) Strengths" that must be invested in communication strategies.

Standardized Residuals (Z-Scores) Heatmap
The matrix does not display the "Observed" raw frequencies brands received; rather, it shows their distances (Z-Scores) from the votes "Expected" based on their market sizes. The diverging heatmap clarifies the positive (green) and negative (red) perception areas that deviate statistically significantly ($Z > \pm 1.96$) from the average.
09
Pure Image Profile (Z-Score Asymmetry)
Diverging Bar Z-Score Profile
"Your Brand's Mental MRI Result Relative to the Market"

It is a model that turns the macro market view of the heatmap into a microscopic examination of a single specific target (e.g., Brand A). It presents us with the psychological asymmetry (Strengths and Weaknesses) the brand exhibits relative to the market average in the form of a clear profile.

Which Questions Does This Analysis Answer?
  • "Stripped entirely of general market dynamics and our own brand size; what are our brand's psychological vulnerabilities where we fall short and which need urgent perceptual repair?"
What Could Be the Added Value to Your Brand?

Provides boards of directors and brand teams with an instant mental MRI result of the brand. It is one of the most refined (bias-free) econometric proofs serving the direct translation of market research findings into operational (SWOT) action plans.

Pure Image Profile Z-Score Asymmetry
This diverging graph centers the zero line (market average/expected value). It ranks the images where the brand is statistically deficient on the negative (left) axis, and the pure inclinations where it dominates the market on the positive (right) axis, according to Z-Score intensity.
10
Halo-Free Brand Clustering
Ward's Method Halo-Free Clustering
"Discover Your Competitors Based on Mental DNA, Not Just Market Share"

When Hierarchical Clustering algorithms are run with raw data, they tend to assign all "large" brands to the same cluster. This model removes market volume from the equation and groups brands solely based on their Standardized Residuals (Z-Scores / Pure DNA).

Which Questions Does This Analysis Answer?
  • Even if our market share and volumetric size differ, who are our 'True Psychological Competitors' sharing the exact same perceptual roots (DNA) as our brand in the consumer's mind?
What Could Be the Added Value to Your Brand?

Offers an eye-opening paradigm in strategic competitive analysis. Enables brands to make correct market positioning not by focusing on those close to them purely in sales volume, but on the brands that fall into the same mental cluster.

Halo-Free Brand Dendrogram
This Dendrogram maps the hierarchy of mental similarity using Euclidean distances between brands and Ward's agglomerative algorithm. The statistically distinct main perceptual clusters are framed with reference bounding boxes, visualizing the market's hidden psychological polarizations.
11
Market Dominating Image Matrix (Horizontal and Vertical Share)
Horizontal / Vertical Share Matrix Analysis
"Which Perceptions Form the Core Identity of Your Brand?"

A model that evaluates the analysis of a single image adjective with a multidimensional asymmetry. By simultaneously measuring the image's dominance in the market and its concentration within the brand's own identity, it tests which adjectives the brand truly "identifies" with.

Which Questions Does This Analysis Answer?
  • Which of the current image statements are the indispensable building blocks where we hold a monopoly in the market (are unrivaled) and that simultaneously form our brand's core identity?
What Could Be the Added Value to Your Brand?

It is an ultimate strategic decision support map for perceptual resource allocation. Guarantees that marketing budgets are invested solely in these niche and profitable perceptions (Blue Ocean) by selecting specific images where competitors are weak in the market and the brand is structurally strong (Upper Right Quadrant).

Horizontal and Vertical Share Image Matrix
This derived Cartesian matrix places "Horizontal Share" (What percentage of this adjective in the market do we claim?) on the X-axis; and "Vertical Share" (What percentage of our brand identity consists of this image?) on the Y-axis. For the target brand, the upper right quadrant determined by median break lines shows the dominated strong perceptions representing the brand's existential "Core Identity".

Let's Take Your Brand's Mental MRI Together

Contact us to decipher consumers' subconscious decisions and your brand's pure perceptual position in the market using advanced psychometric models.