01
Kaplan-Meier Survival and Churn Modeling
▼
"Probabilistic Projection of the Customer Lifecycle and Implicit Churn Functions"
While classic customer retention rates offer a static perspective, "Survival Analysis" centers on the time the customer spends with the brand and models the probabilistic distribution of "when" the churn event will occur.
Which Questions Does This Analysis Answer?
- Statistically, around which month does a specific customer segment tend to sever their relationship with our brand?
- What is the momentum of decline in the probability of retention during critical timelines such as contract renewal periods?
What Could Be the Added Value to You?
- Proactive Churn Management: By detecting the most critical time-windows "before" customer churn occurs, it allows you to focus your retention budget exactly on the right month and the right segment.
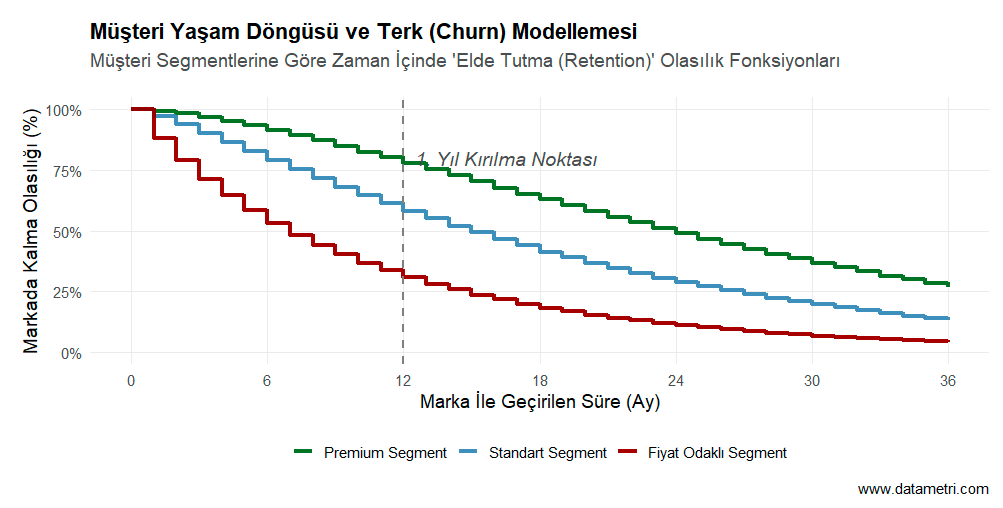
The "Step" function in the visual asymptotically shows the probabilities (Retention) of different consumer segments (Premium, Standard, Price-Oriented) staying with the brand over time. Each downward break of the curves represents the marginal customer loss severity (hazard rate) in that period. The detection of structural thresholds such as the "1st Year Breaking Point" mathematically documents the rate of erosion of customer lifetime value (CLV) on the time axis.