Datametri Logo
01
The Relationship Between Statistical Test Selection and Power Analysis
Statistical Design Methodology
"Guarantee Statistical Validity with the Correct Methodology"

Power analysis parameters (Effect Size, Alpha, Power) vary according to the deterministic structure of the selected statistical test. Incorrect test selection leads to erroneous calculation of the sample size and, consequently, the loss of the scientific (empirical) validity of the research. In the methodological process, the integration of test selection and power analysis is structured according to the following universal standards:

Research Design Test to be Selected Power Analysis Parameter
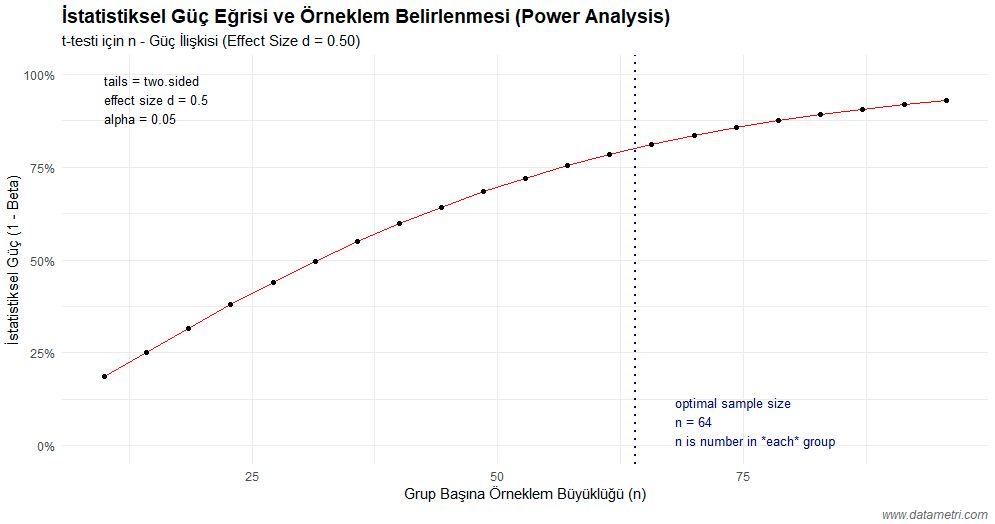
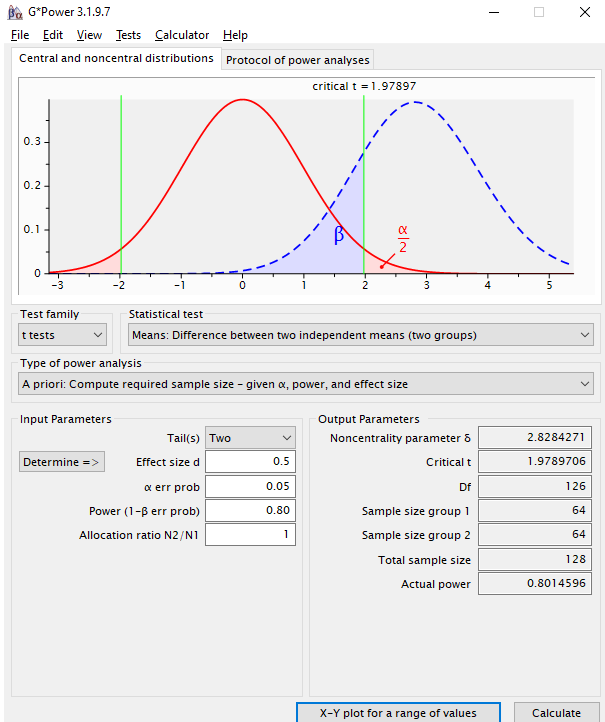
Comparison of two independent groups (e.g., Experimental-Control) Independent Samples t-test Cohen's d (Effect Size)
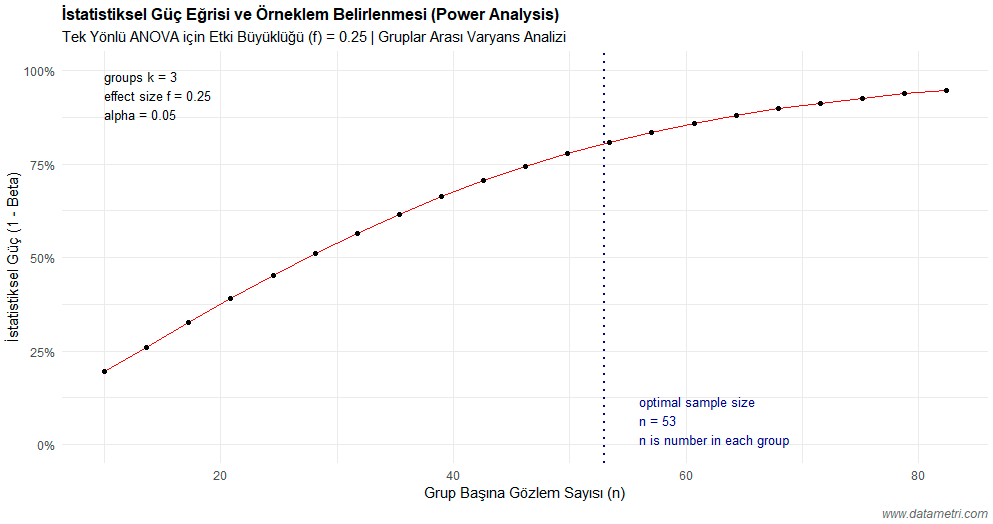
Comparison of three or more groups (One-way variance) One-way ANOVA Cohen's f (Variance Ratio)
Linear relationship analysis between continuous variables Correlation Test Pearson r (Correlation Coefficient)
Independence analysis of categorical/nominal data Chi-square Test w or Cramer’s V
Added Value to Your Research
  • Cross-Validation Confidence: By combining the flexible simulation power of the R programming language with the deterministic precision of G*Power software, we elevate the scientific authority of your methodological report (methods section) to the highest level.
  • Ease of Publication Acceptance and Ethical Approval: We enable you to seamlessly present the "A Priori Power Analysis Report" demanded by peer-reviewers and clinical ethics committees, complete with international APA notations.
  • Design Optimization: We provide analytical support not only on the question of "how many people" but also on how you can use the existing limited sample more efficiently through experimental techniques like "blocking" and "randomization."
02
Application Examples: Two Group Comparison (t-test Design)
t-test G*Power Simulation
"Test the Difference Between Intervention Groups with Scientific Rationality"

The sample/power dynamic has been simulated for Two Group Comparison, one of the most frequently used methods in academic research (especially in medical and experimental designs). This analysis is critical for designs intending to detect the variance difference between intervention groups (intervention vs. control).

Which Questions Does This Analysis Answer?
  • What is the minimum number of subjects/patients I need to observe a "significant difference" in my experimental study?
  • Will the sample I obtained (e.g., n=30) be sufficient to keep the Type II error (the risk of failing to find a difference that actually exists) below acceptable limits?
G*Power 3.1 Analysis:

• Test family: t tests
• Analysis: A priori: Compute required sample size
• Input: Effect size d = 0.5 | alpha = 0.05 | Power = 0.80
• Output: Critical t = 1.978 | Df = 126 | Total sample size = 128
t-test Sample Power Analysis Curve
G*Power Output Screen
The graph shows the sample size required to achieve an 80% power (1 - β) target for an effect size of d = 0.50, considered medium in statistical literature (Cohen, 1988). The breakpoint of the asymptotic curve mathematically proves that a sample of n = 64 units for each group is a methodological necessity to keep the Type II error at the 20% limit. This value obtained in our R simulation is exactly verified by the G*Power terminal output (Actual Power: 0.801).
03
Application Examples: Multiple Group Comparison (ANOVA Design)
ANOVA Analysis of Variance
"Model the Variance Ratio Between Multiple Groups with Precision"

In F-test (ANOVA) designs where three or more groups (different dosage levels, different demographic strata, etc.) are compared, sample rationale is established by analyzing the within-group and between-group distribution of variation.

Which Questions Does This Analysis Answer?
  • To see the variance difference among groups to which I applied 3 different treatment methods, what is the minimum number of subjects I must assign to each cell?
  • In what direction does the inequality in the number of subjects between groups (unbalanced design) affect the overall power of the test?
ANOVA Design Power Analysis
Methodological Interpretation of the Visual: In this scenario where three independent groups are compared, the number of units required for the inter-group variance ratio (Cohen's f = 0.25, medium effect) to reach statistical significance (alpha = .05) and sufficient test power (power = .80) is presented asymptotically. This visual simulation authoritatively displays the impact of sample size on the statistical sensitivity of the test in complex designs.
04
Analytical Supports for Research Design
Randomization Error Control
"Isolate Your Research Design from Variance and Error Sources"

Sample size is only one parameter of statistical validity; true methodological power is hidden in how well the design can isolate error sources and biases (variance isolation). We protect the internal and external validity of your study.

Approaches We Offer Within the Methodological Framework
  • Randomization and Blocking Strategies: We construct "Randomized Block Designs" to statistically neutralize the effect of known confounding variables. This process directly increases the statistical power of the test by reducing the experimental error variance.
  • Sampling Plan Simulation: In complex probabilistic models like Stratified or Cluster sampling, we conduct optimal weighting simulations that minimize the sampling error and the design effect.
  • Validity Audit: We analytically test how resilient your design is against threats such as "Selection Bias" or "Maturation" (Timing effect).
Which Academic Questions Does This Analysis Answer?
  • Methodological Adequacy: Does the research construct I designed meet the "Statistical Methods" quality criteria of the Q1/Q2 quartile journal I am targeting?
  • Error Control (Type I / Type II): Does the sample size I determined keep the Type I (alpha) and Type II (beta) error margins at the thresholds strictly accepted by the literature (0.05 / 0.20)?
Added Value to Your Research

This support we offer as Datametri eliminates "methodological criticisms" (the Reviewer 2 effect), one of the biggest and most exhausting hurdles in the academic publishing process, right from the start at the methodological stage. These power analyses, prepared with a Scientific Rigor perspective, elevate your study to a respected, indisputable level in terms of methodological consistency during the Ethics Committee approval stage, thesis jury defense, and SCI/SSCI article submissions.

Let's Construct Your Methodological Design Together

Share your research hypotheses and data collection plan with us; let's collaboratively build the analytical framework (Power Analysis & Randomization) that will elevate the scientific validity of your study to the highest level.