Datametri Logo
01
Key Driver Analysis (KDA)
Shapley Value Derived Importance
"Which Latent Variables Actually Trigger the Purchasing Decision?"

When consumers are asked how important a feature is, they generally give high scores to all features. Key Driver Analysis (KDA) ignores this misleading importance stated by the consumer (Stated Importance); it calculates the extent to which sub-feature performances trigger "overall satisfaction" or "purchasing intent" via statistical regression (Derived Importance). To resolve multicollinearity among variables, we use Shapley Value Regression, which is based on Game Theory. Thus, we decompose the model's total explanatory power (R²) according to the net and pure contribution of each feature to the final decision.

Which Questions Does This Analysis Answer?
  • What are the structural differences between the factors consumers claim are "important to me" and the factors that "actually" drive their purchasing decisions?
  • Into which 1-2 specific features should we invest our limited marketing and R&D budget to most rapidly drive market share?
What Could Be the Added Value to Your Business?
  • Budget Optimization: Saves managers from investing in consumers' false statements, enabling them to focus on the features that will mathematically increase market share the most, thereby maximizing Return on Investment (ROI).
Importance-Performance Quadrant Matrix (KDA)
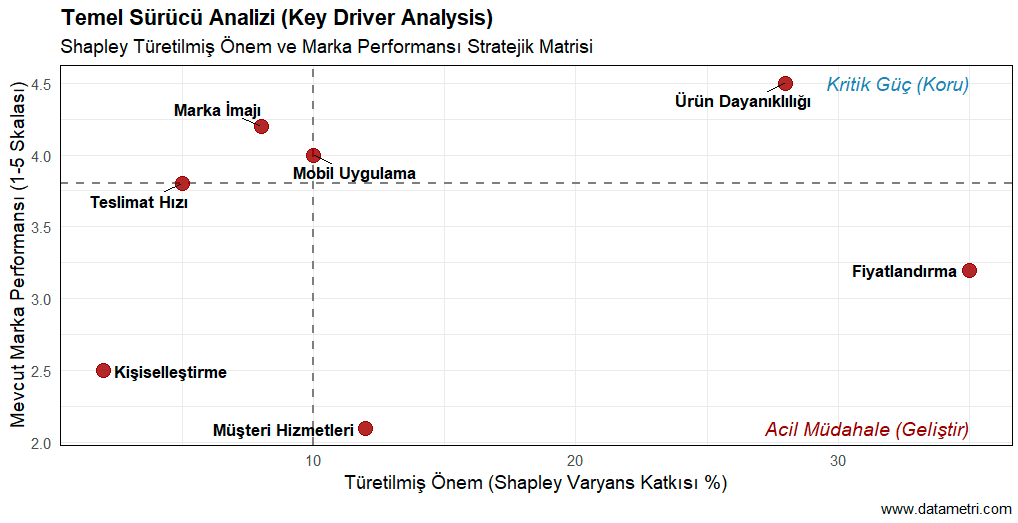
The Importance-Performance Quadrant Matrix in the visual contrasts "Derived Importance", calculated via the Shapley algorithm, with the brand's "Current Performance" in a two-dimensional space. The "Urgent Action" zone in the lower right corner (areas where the mathematical impact on the decision is very high but the brand's performance is low) definitively marks the primary investment targets to which management must allocate budget.
02
Multi-Criteria Decision Analysis (AHP - Analytic Hierarchy Process)
AHP Eigenvector B2B Decision Model
"Approach B2B and Complex Purchasing Decisions with a Rational Foundation"

Especially in industrial purchases (B2B), technology infrastructure selections, or decisions requiring high-involvement such as real estate, the consumer or committee does not act based on a single criterion. The Analytic Hierarchy Process (AHP) breaks down these complex decisions into a tree structure, creates pairwise comparison matrices, and determines the mathematical weight of the criteria.

Which Questions Does This Analysis Answer?
  • With exactly what "weight" do our corporate clients trade-off Quality, Cost (TCO), and After-Sales Support criteria against each other during tender or procurement processes?
What Could Be the Added Value to Your Business?
  • Evidence-Based Value Proposition: By providing B2B sales teams with the decision mathematics of the opposing purchasing committee, it ensures that pitching documents are strategically optimized according to these mathematical eigenvector weights.
AHP Eigenvector Weights
The visual ranks the Global Eigenvector weights of multidimensional B2B purchasing criteria in exact percentages. The greatest academic strength of this analysis, the Consistency Ratio (CR < 0.10), statistically demonstrates that the decision-maker (e.g., a purchasing manager) did not fall into a logical contradiction within themselves when making pairwise comparisons.
03
MaxDiff (Best-Worst Scaling)
MaxDiff Hierarchical Bayes (HB)
"Absolute Prioritization that Eliminates Scale Use Bias"

In traditional Likert-type surveys (scoring between 1-5), the tendency of participants to rate everything a "5" leads to "Scale Use Bias." MaxDiff modeling forces consumers to choose the "Best" and "Worst" (Best-Worst) each time by presenting them with algorithmically determined specific sets. This yields metric absolute distances (ratio-scaled scores) calibrated to an index of 0 to 100 among features, allowing us to state "Feature A is exactly 3.2 times more important than B."

Which Questions Does This Analysis Answer?
  • Of the dozens of brand promises, packaging designs, or features we need to emphasize in a new product launch, which one indisputably holds the top rank in the consumer's mind?
What Could Be the Added Value to Your Business?
  • Message Isolation: By eliminating inflated and indistinguishable survey scores; it allows you to build your marketing, PR, and communication strategy upon singular promises that wield the highest impact.
MaxDiff Hierarchical Bayes (HB) Ridge Plot
While classical analyses summarize the audience with a single mean value; the Ridge Plot in the visual proves that we have drilled our analysis down to the individual level (individual-level utility) using Hierarchical Bayes (HB) algorithms. The horizontal width of the distributions (peaks) indicates the variance (inter-segment heterogeneity) of the importance attributed to that feature within the consumer audience.
04
Discrete Choice Experiments (DCE)
DCE / Choice-Based Cross-Elasticity
"Competitive Market Share Simulations with Random Utility Theory"

Consumers do not evaluate a product in a vacuum (in isolation), but on a shelf (context) where competitors are also present. Discrete Choice Experiments (DCE), based on Daniel McFadden's Nobel-prize winning Random Utility Theory, present consumers with alternative competitive packages and ask them to make a rational "choice". This modeling mathematically predicts consumer utility via Multinomial Logit algorithms.

Which Questions Does This Analysis Answer?
  • If we increase our price by 10%, how much of our current market share will we directly lose to competitor "X"? (Cross-Price Elasticity)
  • In exchange for how much of a discount or extra feature will the consumer break brand loyalty and switch to a competitor's product (brand switching)?
What Could Be the Added Value to Your Business?
  • Simulated Competition: The cost of testing (and failing) any price or packaging change in the field is very high. DCE allows you to make flawless strategic moves by simulating different competitive scenarios risk-free in a digital environment (in silico).
Discrete Choice Experiments Cross-Price Elasticity
The visual is a Cross-Price Elasticity simulation showing how price changes alter the probability of products being chosen (market share). The logarithmic decline (Logit decay) of the curves and the intersection points of the brands clearly reveal market share asymmetries and thresholds of resistance (inelasticity) against competitor pricing.
05
Consumer Decision Trees (CDT)
Decision Tree Category Navigation
"Map the Cognitive Category Navigation in the Consumer's Mind"

On a retail shelf or an e-commerce site, the consumer encounters hundreds of SKUs. However, the mental decision process is not linear. The consumer creates a mental branching by first looking at the "Format" (e.g., liquid vs. powder), then the "Brand", and then the "Size". Consumer Decision Trees reverse-engineer and decipher this mental hierarchy (node & leaf architecture) using agglomerative (bottom-up) clustering or Gini impurity algorithms.

Which Questions Does This Analysis Answer?
  • Does the consumer first search for our specific brand at the moment of purchase, or do they first decide on the package size and then choose among the brands that fit that size on the shelf?
What Could Be the Added Value to Your Business?
  • Retail and UX Optimization: Accelerates conversion by ensuring that shelf layouts (planograms) in physical stores or menu trees (UX navigation) on digital e-commerce platforms are designed directly according to the consumer's natural (cognitive) thinking systematic.
Consumer Decision Trees Radial Dendrogram
The Radial Dendrogram presented in the visual visualizes the decision tree in the consumer's mind not purely in an aesthetic form, but as a cognitive map spreading from the center to the periphery (from the main category to specific SKUs). The distances between nodes determine the priority hierarchy of features in the decision process.
06
Behavioral Decision Modeling: Prospect Theory
Behavioral Econ Loss Aversion
"Mathematical Model of Loss Aversion and Asymmetric Risk Perceptions"

Classical economics assumes that the consumer is fully rational towards price and value. However, Nobel laureate Daniel Kahneman's Behavioral Economics literature (Prospect Theory) has proven that consumers' perception of "gain" and perception of "loss" are entirely asymmetrical. People react much more intensely (on average 2.25 times more) to a loss (e.g., a price hike) of the same amount than they do to a gain (a discount).

Which Questions Does This Analysis Answer?
  • How much statistical difference is there in terms of purchase conversion between presenting a campaign as "Gain 200 TL" versus framing it as "Avoid Losing 200 TL" (framing effect)?
What Could Be the Added Value to Your Business?
  • Pricing Psychology: Minimizes customer loss (churn) during price hikes, subscription cancellations, or surcharges by ensuring the situation is correctly "framed" (Nudging); perceptually steers consumer behavior in campaigns.
Prospect Theory Asymmetrical Value Function
The Asymmetrical Value Function (S-Curve) in the visual documents how the consumer deviates from the rational utility theory. While the gain zone to the right of the reference point (0) rises slowly with "diminishing marginal utility"; the loss zone on the left falls with a much steeper slope (Loss Aversion Coefficient - λ). This is proof that the perceived pain is mathematically greater than the perceived joy (and that loss is a stronger motivator).
07
Theory of Planned Behavior (TPB - SEM Analysis)
TPB Model SEM (Structural Equation)
"Discover the Causal Pathways in the Transformation of Attitudes into Purchasing Behavior"

Just because a consumer likes a product (Attitude) does not mean they will definitely buy it (Behavior). Purchasing is a combination of social circle pressure (Subjective Norms) and the individual's belief that they have the power/ability to buy that product (Perceived Behavioral Control). We apply Structural Equation Modeling (SEM) to model these abstract and latent constructs.

Which Questions Does This Analysis Answer?
  • Our target audience loves our product, but why aren't they buying it (Intention-Behavior Gap)? Is the problem a lack of social approval (norms) or purchasing accessibility (perception of control)?
What Could Be the Added Value to Your Business?
  • Closing the Intention-Behavior Gap: By pinpointing the specific bottleneck in the purchasing journey, it ensures that the marketing communication strategy targets exactly this weak (or high-impact) point.
Theory of Planned Behavior SEM Analysis
The Causal Path Diagram in the visual maps not just correlations, but the directions of causality and the magnitude of effects among latent variables through structural equation equations. How abstract beliefs (norm, attitude, control) trigger one another to transform into final purchasing "intention" and "behavior" is proven via mathematical routes (path coefficients).
08
Non-Compensatory Decision Models (Elimination-by-Aspects - EBA)
EBA Algorithm Non-Compensatory Model
"Identify Consumers' Absolute 'Red Lines' (Hard-Cutoffs)"

Standard Logit models assume that the consumer "compensates" for a deficiency in one feature (e.g., poor camera quality) with an excess in another (e.g., cheap price). However, in real life, consumers have non-compensatory absolute red lines (e.g., "Regardless of price, if it doesn't support 5G, I won't even include that phone in my consideration set"). Lexicographic and EBA algorithms model this non-compensatory process where consumers ruthlessly eliminate alternatives.

Which Questions Does This Analysis Answer?
  • In our product development (R&D) process, what are those critical threshold constraints (deal-breakers) where, "if that feature is missing," the consumer will instantly wipe out all other price/brand advantages?
What Could Be the Added Value to Your Business?
  • Product Isolation Risk (Consideration Set Analysis): Foresees the risk of a newly developed concept being eliminated from the start before even entering the "consideration set" in the eyes of the market, and definitively establishes the minimum requirements (must-haves) for Go-to-market.
Decision Narrowing Waterfall (Elimination-by-Aspects)
The Decision Narrowing Waterfall (Funnel) graph documents the consumer's asymmetrical elimination processes. It visualizes how hundreds of alternatives in the market are logarithmically eliminated at each decision node by the consumer's inflexible "red line" (hard-cutoffs) constraints, dramatically narrowing down the final consideration set.

Let's Simulate the Consumer's Mind Through Modeling

Contact us to decipher the rational and emotional drivers in your consumers' purchasing decisions with advanced algorithms and to determine strategies that will increase your market share.