Datametri Logo
01
Corporate Risk and Predictive Analytics (Bayesian Inference)
Bayesian Models Risk Analytics
"Transform Collective Intelligence into Strategic Foresight"

This analysis goes beyond traditional surveys to measure the "collective intelligence" filtered from the operational experiences of employees in the field. Through Bayesian Updating Models, the budget forecasts of top management are collided with "realistic" data from the field to mathematically calculate strategic deviation risks.

Which Questions Does This Analysis Answer?
  • Do the operational units in the field foresee a market contraction, contrary to management?
  • How feasible are the official budget targets according to the collective intelligence of the employees?
  • How wide has the gap between strategic planning and field reality become?
Added Value to Your Business
  • Early Warning System: Prevents financial losses by revising the budget with signals from the field months before official macroeconomic data is announced.
  • Strategic Alignment: Ensures the organization focuses on the same objective by mathematically demonstrating the expectation gap between management and the field.
Bayesian Probability Density Graph
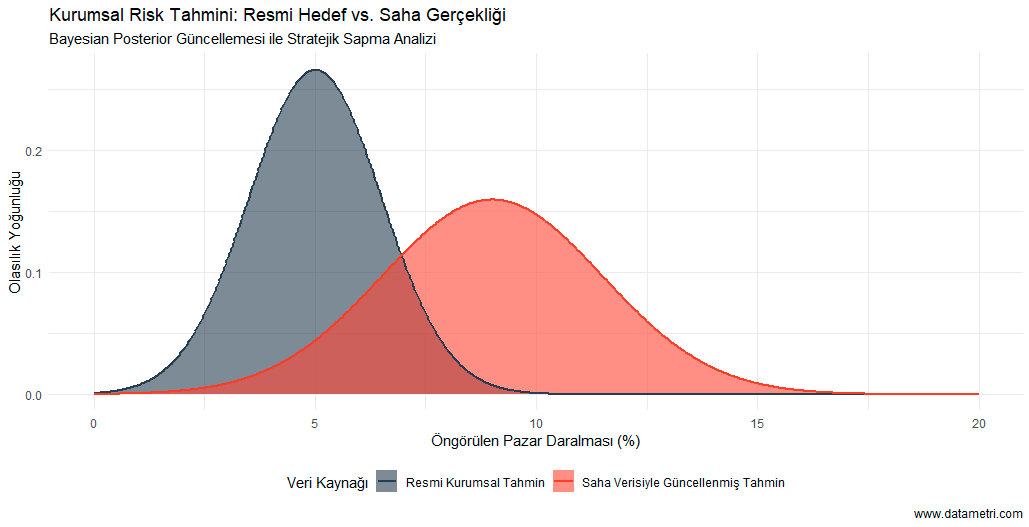
This probability density graph illustrates the "Market Contraction Uncertainty" for the upcoming quarter. The dark blue curve (Prior) represents the company's official and optimistic forecast; the red area (Posterior) represents the realistic probability distribution updated with field feedback. The shifting of the red area to the right (into the high contraction zone) indicates that the official targets should be revised.
02
Supplier Risk Segmentation (K-Means Clustering)
K-Means Clustering Segmentation
"Discover the Invisible Bottlenecks in the Supply Chain"

Supplier management is not solely about performance scoring. In this model, suppliers' feedback regarding the enterprise (process sluggishness, payment terms, order clarity) is combined with their own performance data via Clustering Analysis (Unsupervised Learning). Thus, supply chain security is redefined through "administrative efficiency".

Which Questions Does This Analysis Answer?
  • Which suppliers are losing operational efficiency due to our administrative sluggishness?
  • Where are the "single point of failure" risks concentrated in the supply chain?
  • Who are our most valuable partners, not just by volume, but by ease of collaboration?
Added Value to Your Business
  • Operational Efficiency: Accelerates supply speed by rectifying process hitches reported by suppliers.
  • Cost Management: Minimizes production halts and expedited shipping costs by identifying suppliers in the risky group beforehand.
Supplier Risk Clustering Map
In the risk map below, each dot represents a supplier. The green cluster shows high-performing strategic partners; the red cluster shows the "Critical Risk" group that experiences operational issues and complains about corporate processes.
03
Customer Feedback Analytics and Portfolio Optimization
NLP Correlation Analysis
"Discover Customer Character, Turn Losses into Gains"

Customer feedback is not merely a list of complaints, but a leading indicator of future purchasing behaviors. In this analysis, the correlations between complaint topics classified via Natural Language Processing (NLP) and the financial values of the customers (RFM metrics) are examined. Consequently, customized strategies are developed for each segment.

Which Questions Does This Analysis Answer?
  • Which of my customers are my business's "Champions" and most valuable assets?
  • Who constitutes my "Emerging" audience with the potential to become loyal customers in the future?
  • Can a "Lost Segment" classification be made based on the most recent purchase date and feedback?
Added Value to Your Business
  • Budget Optimization: Enables you to protect profit margins by using strategies that make the loyal customer base feel special (priority service, etc.) instead of giving discounts to everyone at once.
  • Precise Targeting: Ensures you take precautions against customer churn before it happens via intervention messages sent exactly on time to an audience on the verge of being lost.
Customer Feedback Correlation Matrix
The dark red cells in the correlation matrix prove the high impact of specific operational issues (e.g., Shipping Delay) on customer churn. This map is an investment guide demonstrating upon which problem limited resources should be spent to resolve.
04
Operational Process Mining
Process Mining Bottleneck Analysis
"Make Bottlenecks in the Process Flow Visible with Field Data"

The "things aren't working" notifications coming from field teams are matched with the timestamps of operational transactions to create a Process Network. This model targets operational excellence by validating subjective complaints with objective delay data.

Which Questions Does This Analysis Answer?
  • At which stage of the process does the operational flow come to a standstill?
  • Are the points where complaints aggregate truly the places with the highest time loss?
  • Which operational node should be improved first for an increase in efficiency?
Added Value to Your Business
  • Resource Allocation: Provides maximum operational speed increase with minimum effort by targeting the "thickest and reddest" line on the graph.
  • Interdepartmental Transparency: Strengthens interdepartmental coordination by demonstrating where the problem lies based on data.
Operational Process Network Map
In this process map, the thickness of the lines represents the delay duration, and the color turning red represents the feedback density at that stage. This is an operational x-ray indicating where resources should be directed.

Let's Initiate Your Internal Research

Share your feedback or employee survey data with us within the scope of GDPR; let's collaboratively evaluate how to measure your collective intelligence.