Datametri Logo
01
Clinical and Experimental Studies
RCT Mixed-Design ANOVA

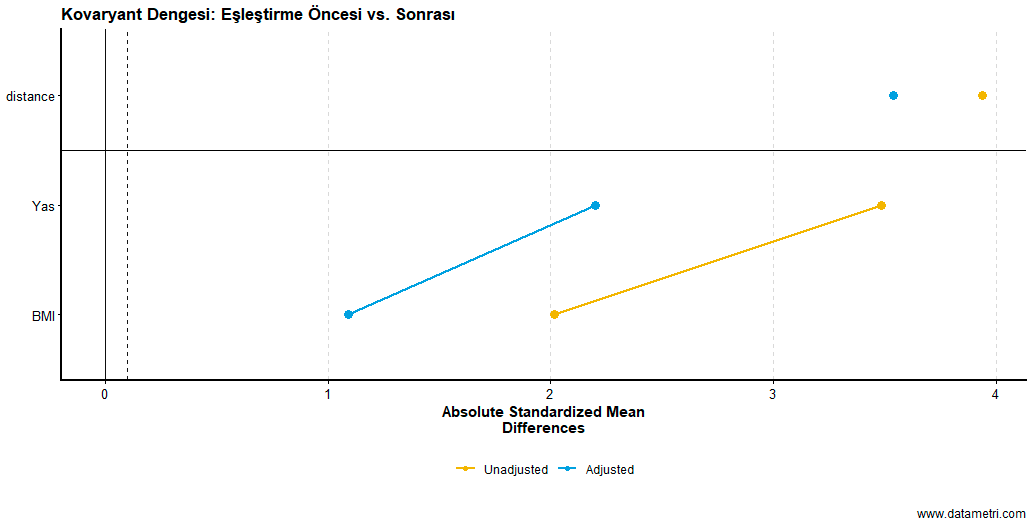
In these studies where intervention and causality are tested, data precision and statistical homogeneity of the groups are central to the analysis.

  • Randomized Controlled Trials (RCT): Starting from the process of randomly assigning participants to groups, we analyze the effectiveness of the intervention with the highest statistical power.
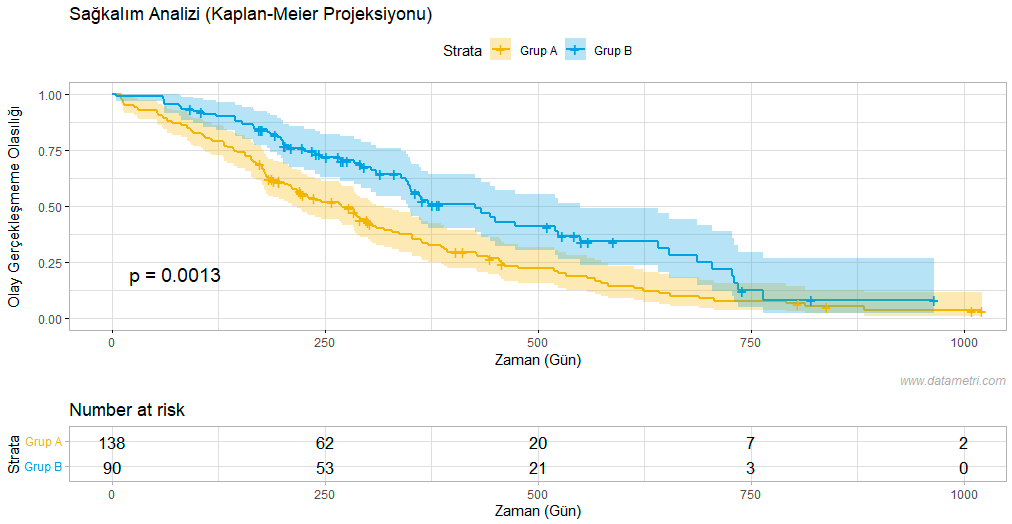
  • Pre-Test / Post-Test Designs: We model pre- and post-intervention changes in a temporal dimension through repeated measures (Repeated Measures ANOVA or Mixed Design ANOVA).
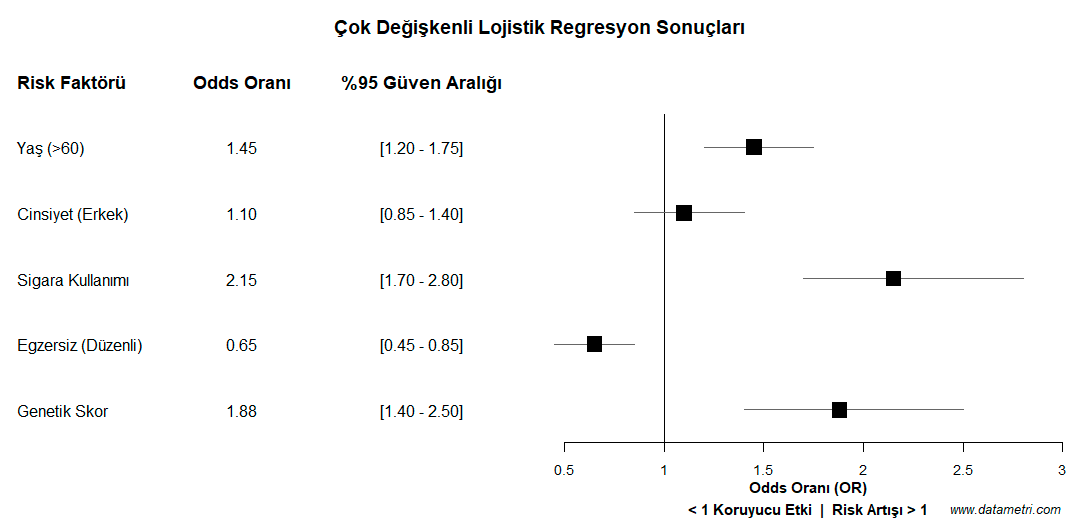
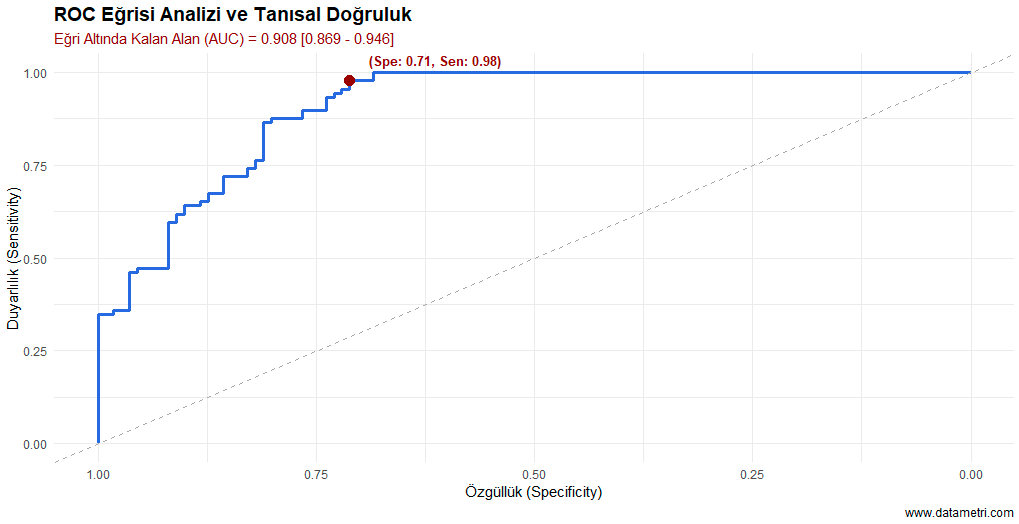
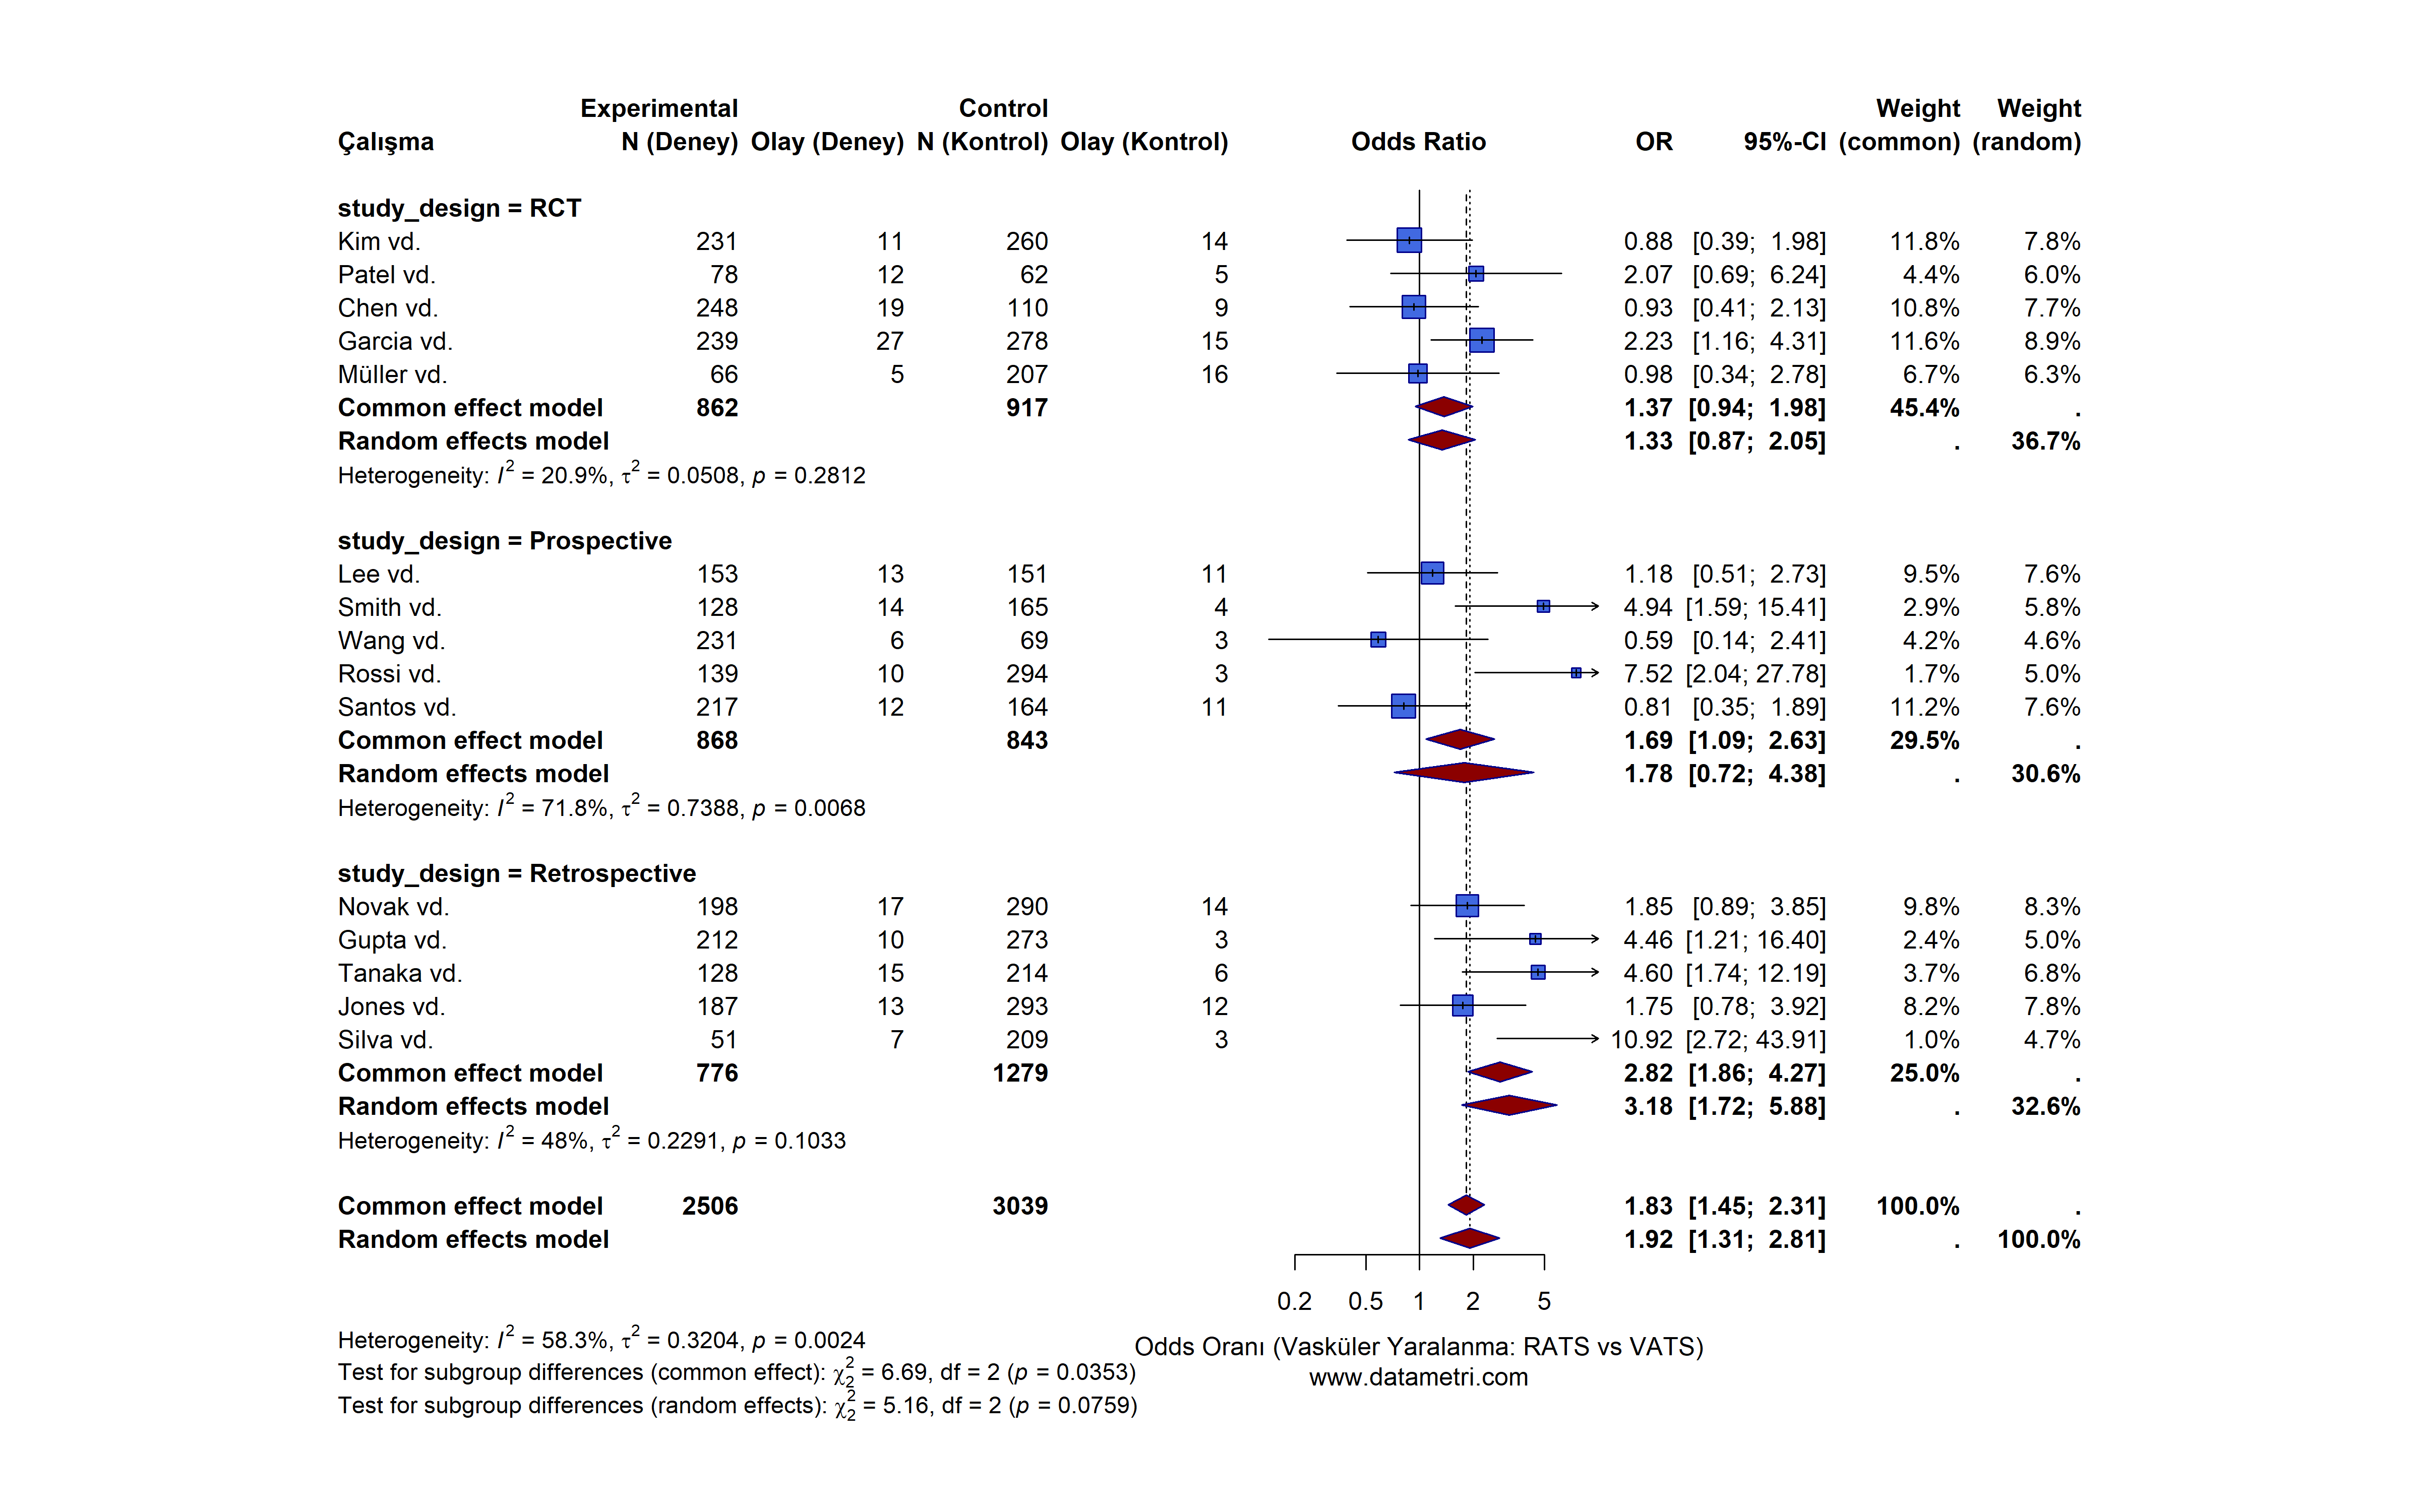
  • Biostatistical Parameters: We report Relative Risk (RR), Odds Ratio (OR), Sensitivity, and Specificity coefficients, which are vital in clinical studies, alongside their confidence intervals (95% CI).
Which Questions Does This Analysis Answer?
  • Does the independent variable (intervention) have a time-invariant main effect?
  • Is there a statistically significant interaction effect between time and group variables?
Added Value to Your Research

Beyond statistical significance (p < 0.05), it provides an evidence-based presentation of the intervention's effect size. It enhances methodological validity by minimizing repeated measurement errors that may arise in time series data.

Mixed-Design ANOVA
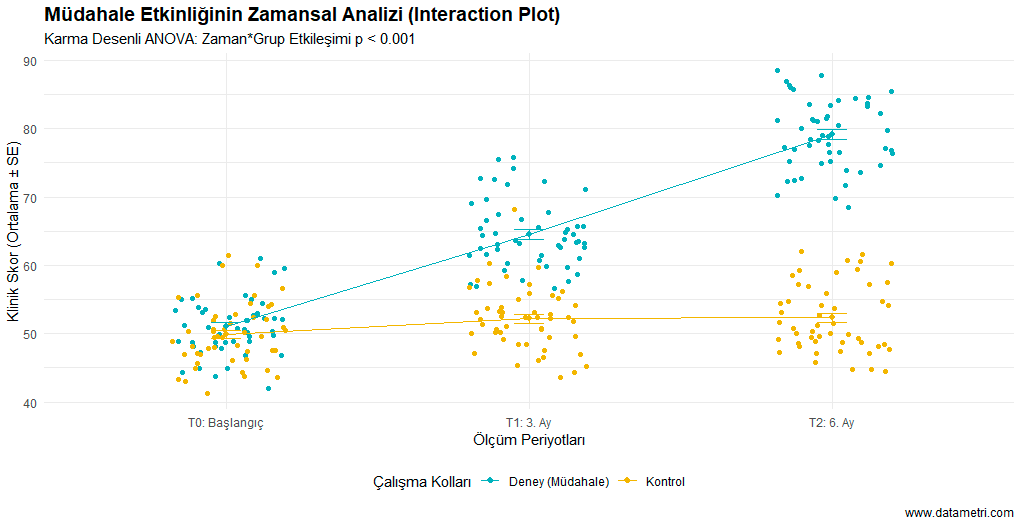
The graph represents the output of a Mixed-Design ANOVA. The interaction effect of between-subjects (experimental and control) and within-subjects (time) factors on the dependent variable is examined. The positive linear trend in the experimental group alongside the stable progression in the control group demonstrates the cumulative effect of the applied intervention over time.
02
Observational and Retrospective Studies
PSM Love Plot Logistic Regression

In retrospective studies or those examining existing data without intervention, statistical control of confounding variables is the primary priority.

  • Cohort and Case-Control Studies: We analyze the effects of risk factors and exposures on the outcome using advanced Logistic Regression models.
  • Cross-Sectional Research: We model prevalence and relationships at a given point in time, accounting for complex survey weights.
  • Confounding Variable Control: To prevent bias in observational studies, we apply Propensity Score Matching (PSM) techniques that statistically balance the groups.
Which Questions Does This Analysis Answer?
  • What is the net (independent) effect of a specific risk factor on the dependent variable when confounding variables are included in the model?
  • Can a quasi-experimental causal relationship be established by compensating for the lack of randomization?
Added Value to Your Research

Elevates the research's position in the hierarchy of evidence by eliminating "confounding effect" criticisms, which are the greatest methodological weakness of observational data. It is indispensable for Real World Evidence studies.

Multivariate Logistic Regression Forest Plot
The Forest Plot displays the Adjusted Odds Ratios (Adjusted OR) and 95% Confidence Intervals obtained from the Multivariate Logistic Regression model. Variables to the right of the reference line (OR = 1) indicate an increased risk, while those to the left signify a protective effect.
Propensity Score Matching Love Plot
This "Love Plot," which monitors the performance of the Propensity Score Matching (PSM) algorithm, illustrates covariate balance. The fact that the unadjusted high bias level drops below the acceptable threshold post-matching (adjusted) proves that inter-group selection bias has been eliminated.
03
Diagnostic Test and Survival Analyses
ROC/AUC Kaplan-Meier & Cox
"Model Clinical Decision-Making Processes Focusing on Accuracy and Time"

ROC Curve Analysis: By determining the cut-off points of diagnostic tests, we certify the test's discrimination performance with the Area Under the Curve (AUC) value.

Kaplan-Meier and Cox Regression: We model survival times and Hazard Ratios (HR) via time-dependent variables, preparing life tables to academic standards.

Which Questions Does This Analysis Answer?
  • What is the specific cut-off threshold that maximizes the model's classification performance and optimizes both Type I and Type II errors?
  • What is the survival probability of the event not occurring at a particular follow-up point?
Added Value to Your Research

Prevents deviations stemming from missing data by incorporating into the mathematical model censored data of individuals lost to follow-up or those who do not experience the event during the study period. This is mandatory for the clinical validation of a new biomarker's cut-off value.

ROC Curve and Optimal Cut-off Point
The ROC curve demonstrates the classification model's capacity for discrimination. The marked point represents the "optimal cut-off point" determined by the maximization of the Youden Index (J).
Kaplan-Meier Survival Analysis
This is the survival function based on the Kaplan-Meier estimator. Stepwise declines in the curves represent the time points when the targeted event occurred. The "Number at Risk" table ensures methodological transparency.
04
The Pinnacle of Evidence Hierarchy: Advanced Meta-Analysis Applications
Meta-Regression PRISMA

Going beyond primary data research, systematic reviews and meta-analyses that statistically pool the findings of independent quantitative studies published in the literature are registered as Level I Evidence in evidence-based medicine and social sciences. Our analysis procedures are fully compliant with the PRISMA guidelines.

A. Heterogeneity and Sub-Group Analyses

When calculating the overall effect of conflicting studies, we do not ignore methodological differences. We stratify studies based on predetermined categorical moderators.

Added Value to Your Research

Resolves the problem of "inconsistency" in the literature. Mathematically isolates the source of differences without falling into the "comparing apples and oranges" fallacy frequently criticized by reviewers.

B. Publication Bias Audit

We overcome the "file drawer problem"—the tendency for only statistically significant (p < .05) results to be published in the literature—using advanced diagnostics.

Added Value to Your Research

High-impact Q1 journals will not review any meta-analysis where publication bias has not been tested and adjusted via algorithms like Trim&Fill. We secure the reliability of the model using simulation algorithms.

Sub-Group Analysis Forest Plot
This Forest Plot synthesizes the effect sizes (OR) and 95% Confidence Intervals of the studies via a Random-Effects Model. The dark red diamonds indicate the pooled net effect size.
Contour-Enhanced Funnel Plot (Trim and Fill)
The Contour-Enhanced Funnel Plot is an audit of publication bias combined with Egger's Test. The salmon-colored triangles represent the "unpublished/missing" studies simulated by the Trim and Fill algorithm and imputed into the model.
05
Multivariate Causal Networks (Structural Equation Modeling)
SEM / MSEM Causal Networks

Modern scientific research has reached a complexity where multidimensional phenomena such as human behavior, clinical pathologies, or organizational dynamics can no longer be explained by one-way, linear, and isolated variable pairs. International peer-reviewed journals in the Q1 segment and top-tier funding boards now demand going beyond the question of "Which variables are correlated with each other?".

A. Full Structural Equation Modeling (Full SEM)

The traditional Baron and Kenny stepwise regression method resolves multiple paths independently of each other, increasing the Type I error rate. Datametri's Full Structural Model simultaneously resolves the entire causal network in a single variance-covariance matrix.

B. Multilevel SEM (MSEM) and RI-CLPM

Applying standard regression to hierarchical data creates an "Ecological Fallacy." MSEM mathematically separates individual and group-level error margins. The RI-CLPM model, on the other hand, proves "Pure Causal Inference" by eliminating trait-like stable properties among individuals in longitudinal data.

Full Structural Equation Modeling and Mediation Effect
The statistical significance of the Mediation effect was tested with confidence intervals obtained by resampling the dataset thousands of times (Bootstrap resampling).
RI-CLPM Reciprocal Causality
The RI-CLPM diagram isolates individuals' invariant personality traits (Random Intercepts) in time series data and parameterizes the cross-lagged paths between variables in an error-free causality loop.

Let's Prepare Your Clinical Research for Publication

Share your dataset and research hypotheses with us; let's collaboratively build the analytical architecture that will ensure your study gets accepted in SCI/SSCI-indexed journals.