Datametri Logo
01
Learning Measurement and Item Response Theory (IRT) Integration
Item Response Theory Latent Trait Estimation

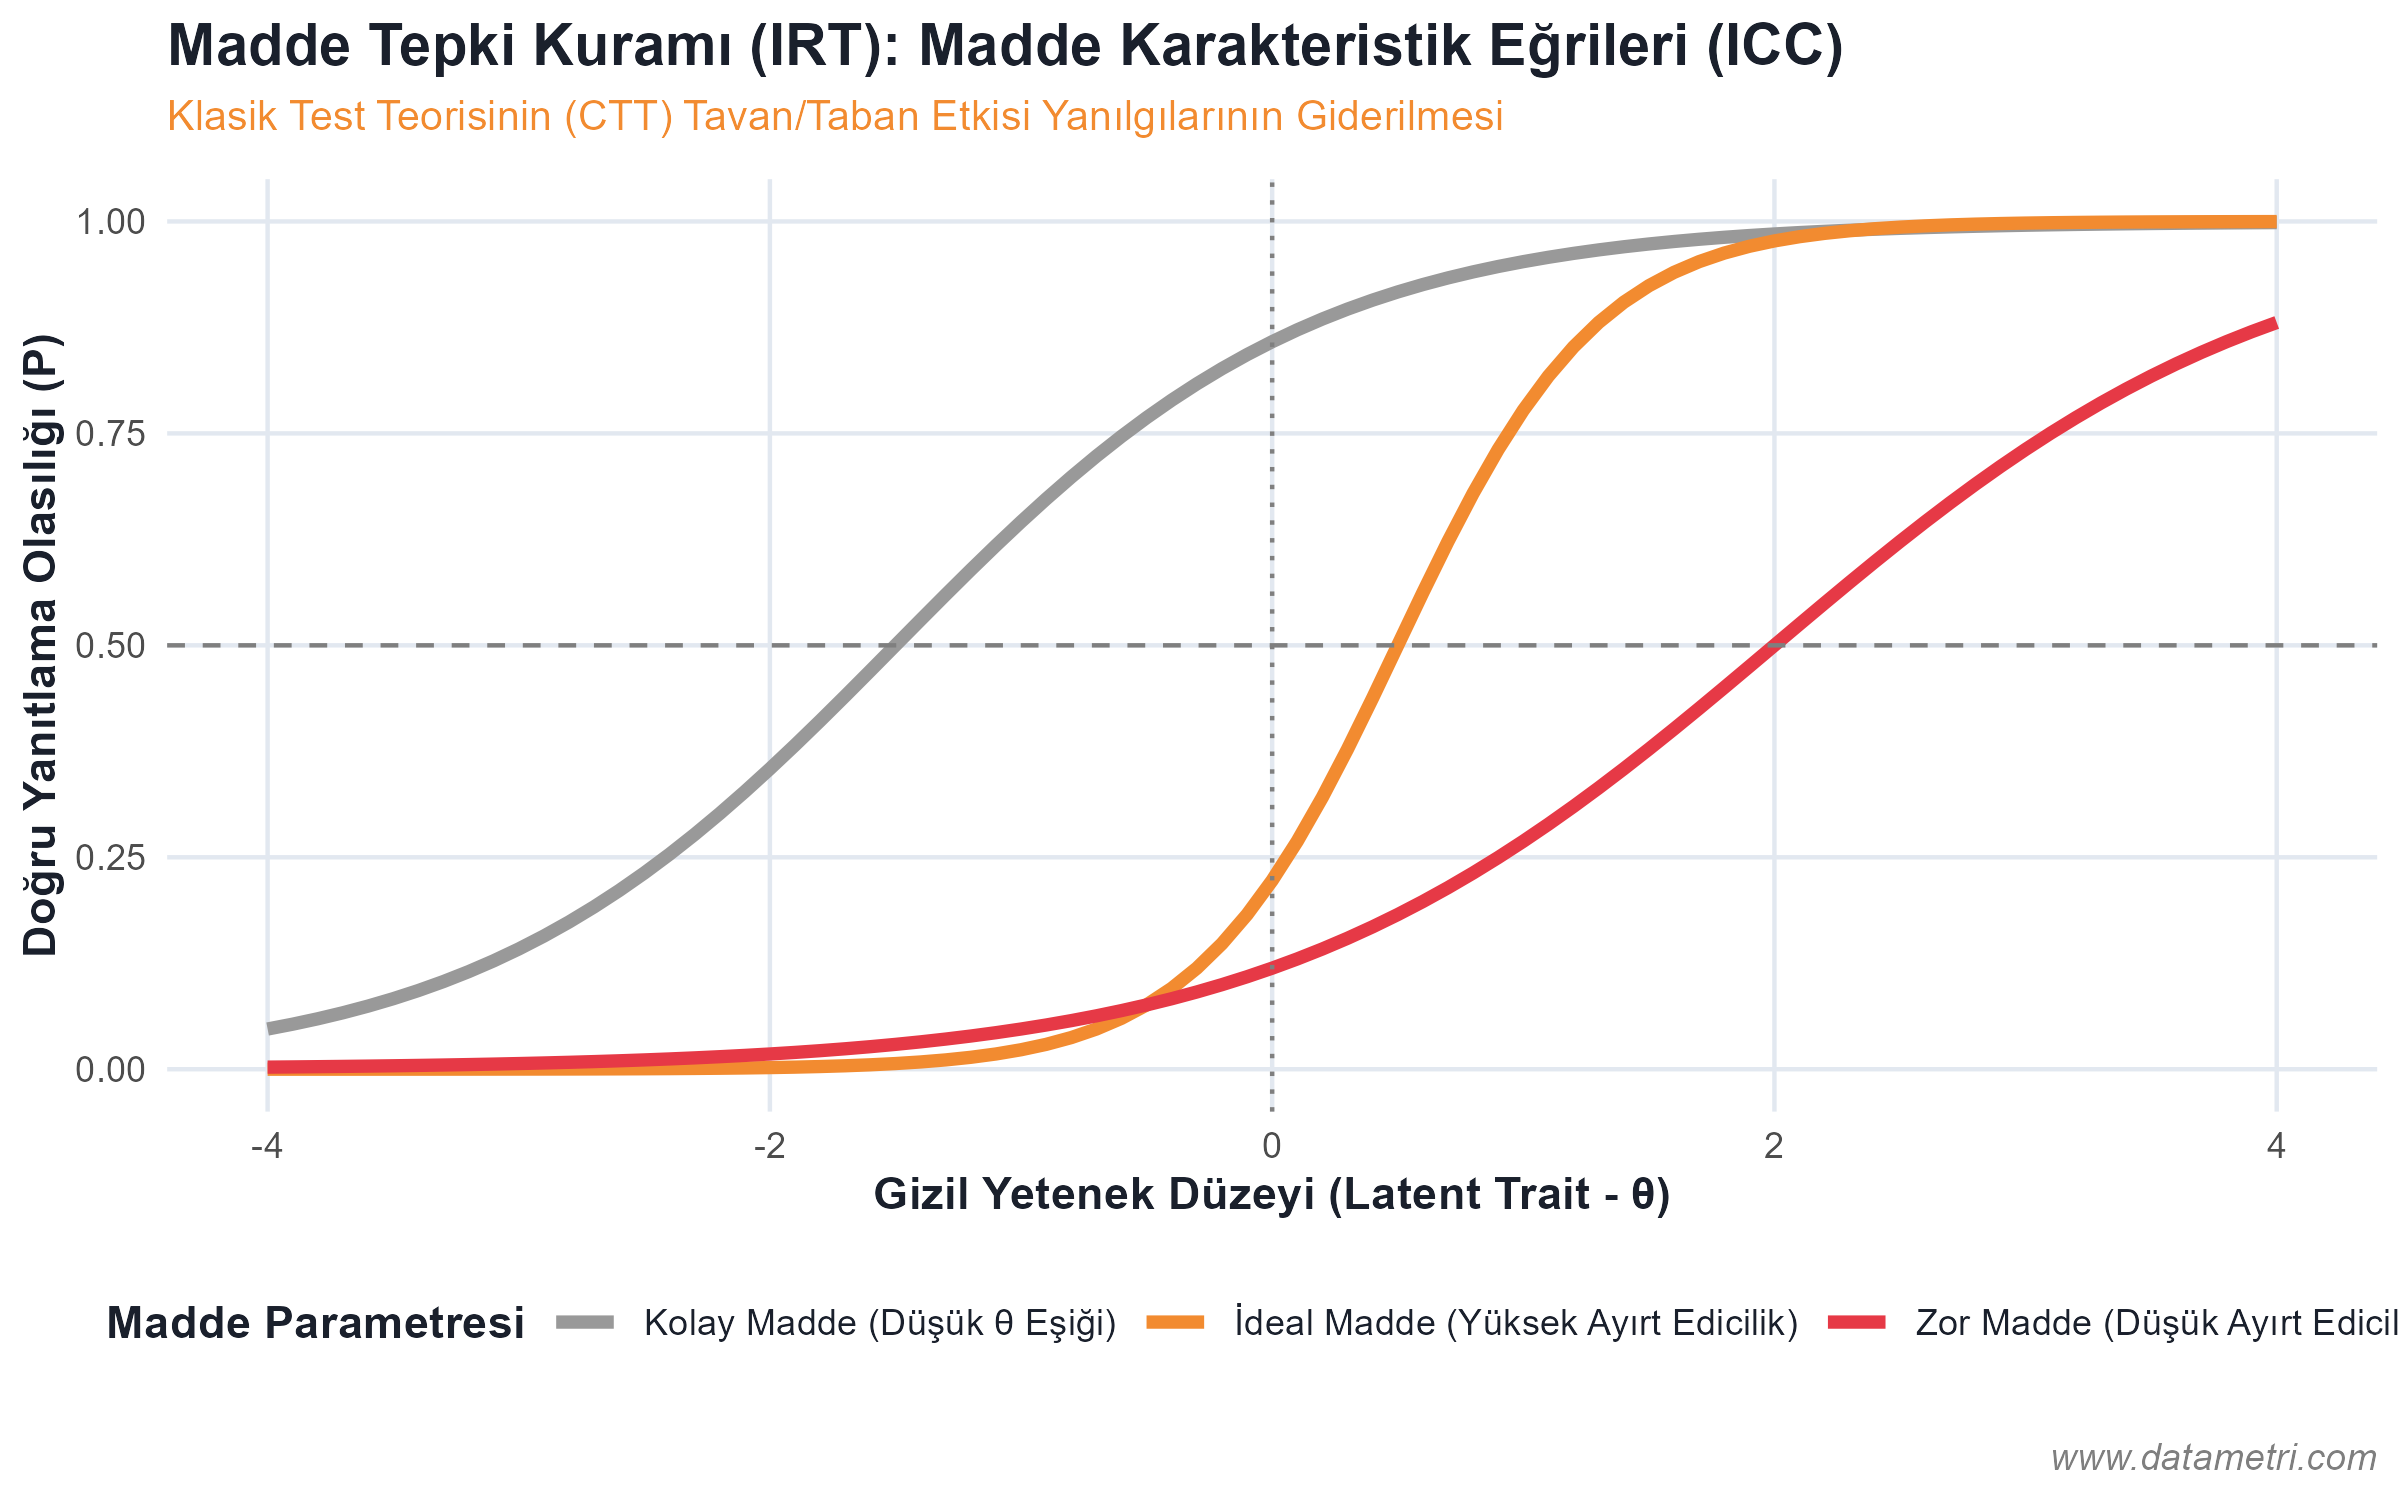
Evaluating the knowledge level of participants after training with absolute scores within the framework of Classical Test Theory (CTT) (e.g., getting 80 out of 100) is highly susceptible to measurement error. Because each question in the test has a different Item Difficulty index and Discrimination power. We ground our evaluation designs on the foundation of Item Response Theory (IRT), which centers on the test item rather than the participant.

Isolated Biases and Countermeasures
  • Ceiling and Floor Effects: To prevent measurement restrictions arising from the test being too difficult or too easy, we calibrate item characteristic curves (ICC); preventing the fallacy of equating an employee who knows easy questions with an employee who knows difficult questions at the same absolute score (Test-wiseness Bias).
  • Latent Trait Estimation ($\theta$): Not just the participant's number of correct answers, but their true Latent Ability is calculated with logit/probit models based on the parameters of the questions.
IRT Item Characteristic Curve (ICC)
caption = 'www.datametri.com'
Our goal is to ensure that training departments prove that the test can measure participant competency with a zero margin of error (Item Information Function), rather than relying on superficial frequencies like "Our exam was easy, our pass rate is 90%."
02
Behavioral Transfer and Longitudinal Analysis
Longitudinal Analysis Latent Growth Curve

Cross-sectional data is not sufficient to measure whether the theoretical knowledge gained in the classroom (or on a digital platform) turns into an observable and permanent corporate behavior (Transfer of Training) in the actual operation field. Behavior change requires longitudinal econometric monitoring spread over a time series.

Isolated Biases and Countermeasures
  • Rater Bias and Halo Effect: The behavioral change of the personnel in the field is measured not only by their own self-report (Recall Bias) or the subjective opinion of a single manager; but with 360-degree designs involving supervisors, subordinates, and customers. Discrepancies between raters (Inter-rater Reliability) are filtered out using Hierarchical Linear Models (HLM).
  • Decay Effect: Repeated measurements taken immediately after the training, in the 3rd month, and in the 6th month are analyzed with Latent Growth Curve Modeling (LGCM); algorithmically determining how the acquired competency decays over time and at what point a refresher training is needed.
Longitudinal Growth and Decay Model
caption = 'www.datametri.com'
It proves that training outcomes are not a one-time measurement, but a structural time curve where inter-individual variances (Random Effects) and the general corporate trend (Fixed Effects) are decomposed.
03
Business Outcomes and Bayesian Causal Impact Isolation
Causal Impact Bayesian Time Series

A 15% increase in operational profitability following sales training is a correlational finding; it does not prove causality. This increase might be a direct result of the training program, or it could be a reflection of a macroeconomic revival in the market (exogenous shock) or seasonality. Training ROI only gains legitimacy when these exogenous confounders are removed from the equation.

Isolated Biases and Countermeasures
  • Exogenous Confounding Variables: We pit the performance data of the personnel/stores that participated in the training against the data of a "Synthetic Control" group that did not participate but has structurally similar covariate characteristics.
  • Net ROI Mathematization: Using Bayesian Structural Time Series models, we calculate the pure intervention effect (Causal $\Delta$) remaining when exogenous factors are purged. This pure effect is divided by the operational training cost, and "the marginal financial contribution brought to the institution by 1 unit invested in training" is reported with statistical confidence intervals ($p < 0.05$).
Bayesian Causal Impact and Synthetic Control Group
caption = 'www.datametri.com'
It enables Training (L&D) managers to establish empirical authority by stating "The net isolated causal effect of our training investment on the balance sheet is 1.2 Million TL" rather than abstract arguments like "The training provided motivation".
04
Cognitive Dissonance and Expectation Management (Expectation-Confirmation Theory)
Gap Analysis Dumbbell Plot

"Dissatisfaction" in the measurement and evaluation process does not always stem from the training content or trainer quality (operational inadequacy). Often, the problem is the structural deviation between the "Expectation" created by the institution prior to the training and the actual "Confirmation" in the field. This methodology models communication and perception mismatches geometrically.

Isolated Biases and Countermeasures
  • Cognitive Dissonance: By directly measuring the psychological tension (Negative Disconfirmation) created by the difference between the participant's pre-training perception and post-training experience, we calibrate the alignment of internal corporate communication (promises) with operational reality.
Expectation-Confirmation Dumbbell Plot
caption = 'www.datametri.com'
This analysis presents a diagnostic dataset to the board of directors regarding whether participant resistance to training stems from the training content or from misaligned communication strategies.

Let's Transform Your Educational Programs into a Scientific Investment

Contact us to measure the permanence (decay) of your trainings and the marginal financial return (ROI) they provide to your company with econometric models.