"Innovation, Segmentation, and Willingness to Pay (WTP) Simulations via Discrete Choice Experiments"
Conjoint analysis is the gold standard of pricing, consumer preferences, and new product development (NPD) science in market research. Instead of having consumers vote on product features individually in isolation (which often leads to the ceiling effect); it presents them with alternative combinations featuring different prices, packaging, and attributes, just as if they were on a real competitive market shelf, and algorithmically decomposes the consumer's implicit preferences (Discrete Choice).
It Should Not Be Forgotten That There Is a Conjoint Ecosystem: While we reference the basic Choice-Based (CBC) model here, conjoint analyses offer a massive spectrum depending on the research architecture. While CBC (Choice-Based Conjoint) is used for simple decision processes like fast-moving consumer goods (FMCG); ACA (Adaptive Conjoint Analysis), which reduces the consumer's cognitive load, is deployed in complex studies involving dozens of technical details (40+ features) such as automotive, technology, or real estate. For asymmetric scenarios where the consumer is involved in the process with "Build-Your-Own" modules and negotiates the price, ACBC (Adaptive Choice-Based Conjoint), the most advanced econometric variant, is applied. At Datametri, we construct the algorithmic design most appropriate for the structural equations of the project.
Our model rejects deterministic market averages (aggregate estimation). Hierarchical Bayes (HB) estimation performs tens of thousands of simulations using Markov Chain Monte Carlo (MCMC) iterations and creates a heterogeneous "Part-Worth Utility" matrix for each individual participating in the survey. Some of the advanced analytical outputs we offer through this massive data matrix are:
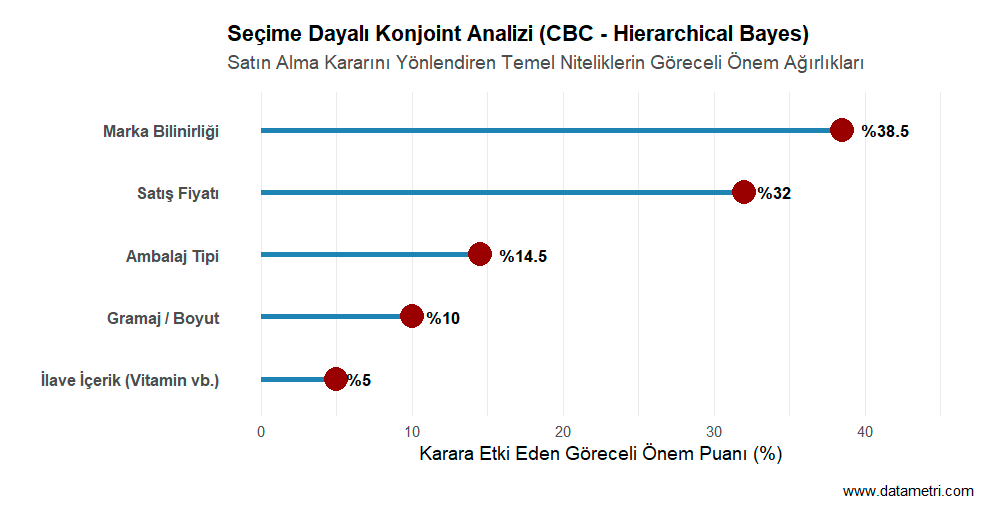
6.1. Relative Importance Weights of Key Attributes (Attribute Importance)
The Greatest Strength That Sets This Analysis Apart
It excludes the misleading answers obtained when consumers are directly asked "How important is price to you?". It algorithmically calculates the relative importance levels of features based on the actual "trade-off" behaviors the consumer makes on screen.
Which Questions Does This Analysis Answer?
- Is the consumer truly buying our product for our brand's Brand Equity, for a specific technological feature we offer, or solely because of our price competitiveness?
Added Value to the Researcher:
- Reveals with statistical certainty the most critical "Value Proposition" that needs to be emphasized in communication strategies and advertising copy.
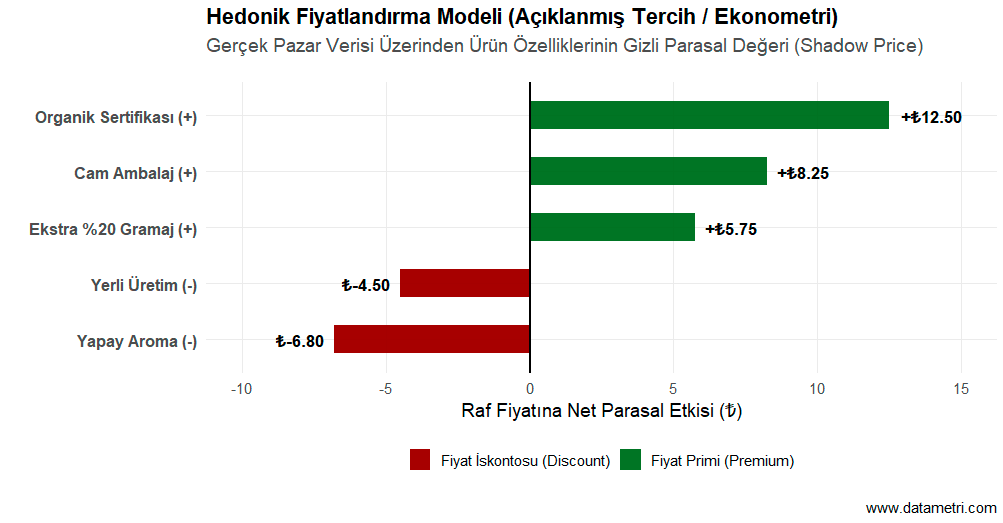
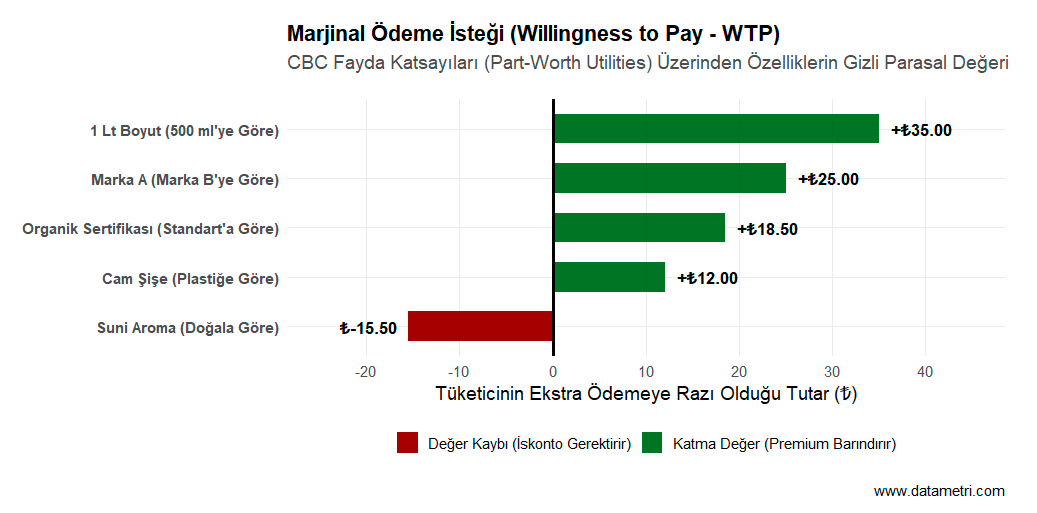
6.2. Marginal Willingness to Pay (WTP) Valuation
The Greatest Strength That Sets This Analysis Apart
It rejects the speculative nature of Direct Questioning approaches. By calculating the Marginal Rate of Substitution between feature utility coefficients and price coefficients; it mathematically extracts the exact monetary equivalent (₺/$) of a product feature (e.g., "Organic Certificate") in the eyes of the consumer.
Which Questions Does This Analysis Answer?
- Should we bear the production cost of feature "X" that we plan to add to the product during the R&D stage; will the marginal willingness to pay (WTP) assigned by the consumer to this feature cover our cost?
Added Value to the Researcher:
- Prevents R&D departments from making "over-engineering" mistakes that would lower profitability while developing product prototypes.
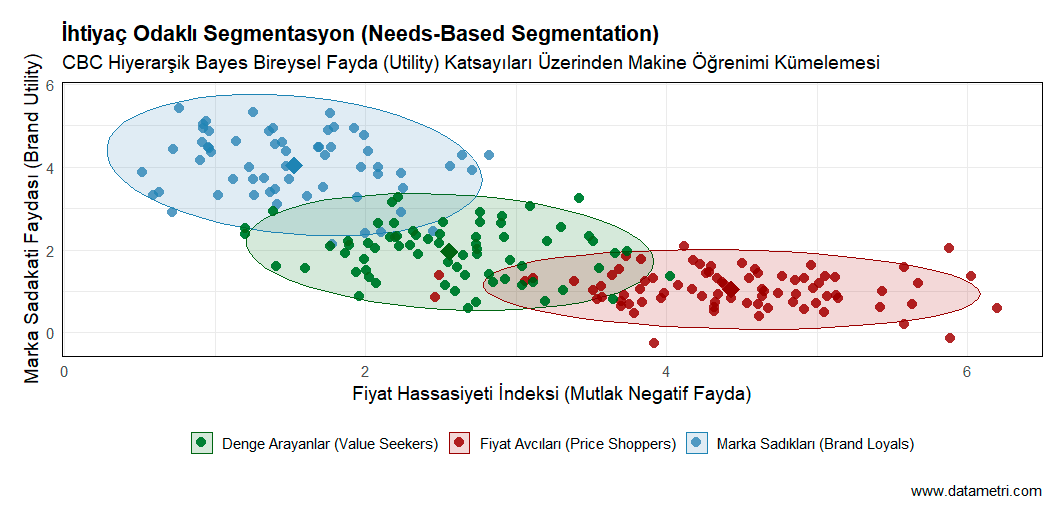
6.3. Needs-Based Conjoint Segmentation
The Greatest Strength That Sets This Analysis Apart
It clusters consumers not by age, gender, or superficial stated expressions; but directly according to the utility coefficients obtained from the Hierarchical Bayes model (via K-Means / LCA). In other words, demographics may lie, but trade-off metrics do not.
Which Questions Does This Analysis Answer?
- Within the market, which are the hidden motivational subsets that may be demographically similar but actually react solely to "Price" or solely to "Innovation"?
Added Value to the Researcher:
- Creates actionable and profitability-focused niche target audiences that can perfectly match the heterogeneous structure of the market with product variants (e.g., Economy Size vs. Premium Series).
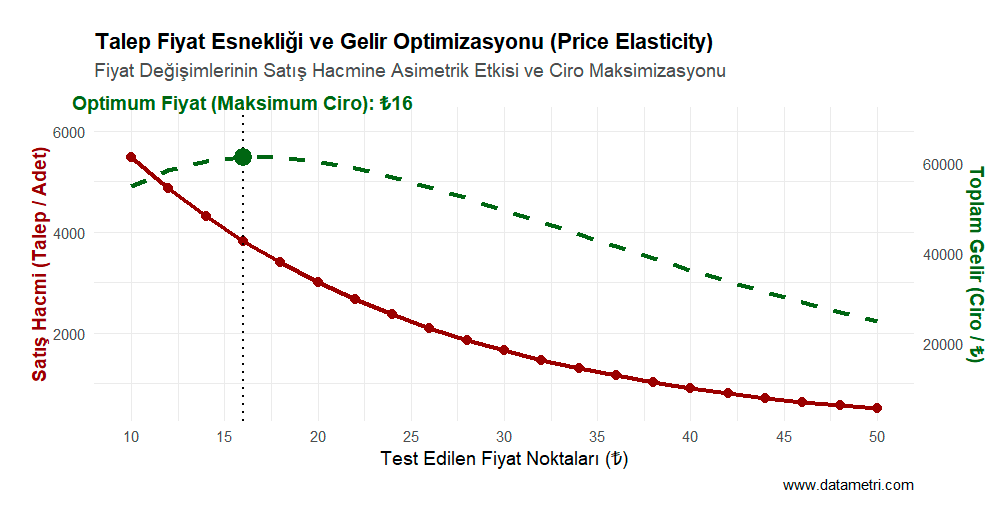
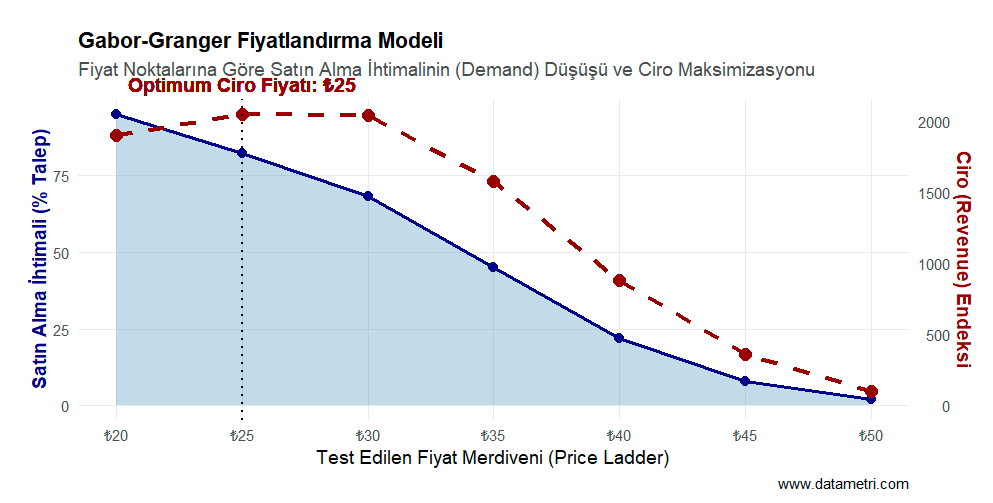
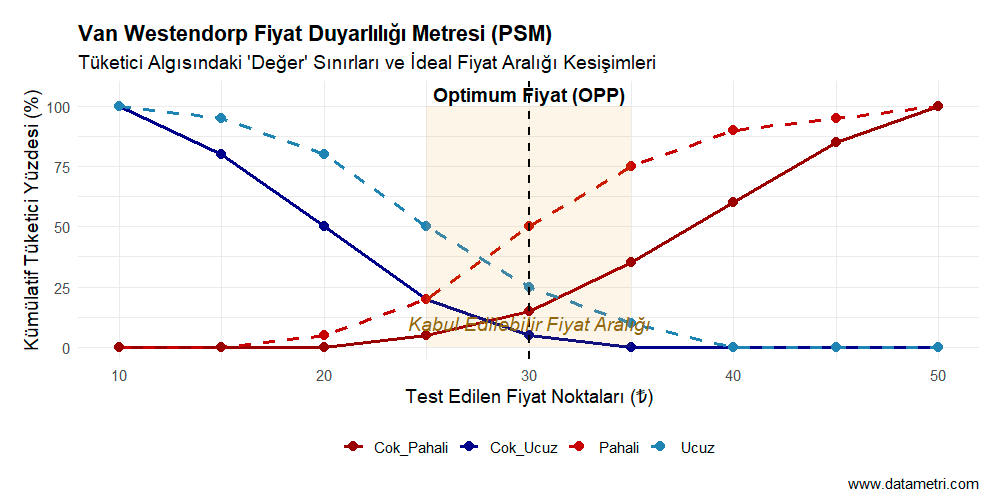
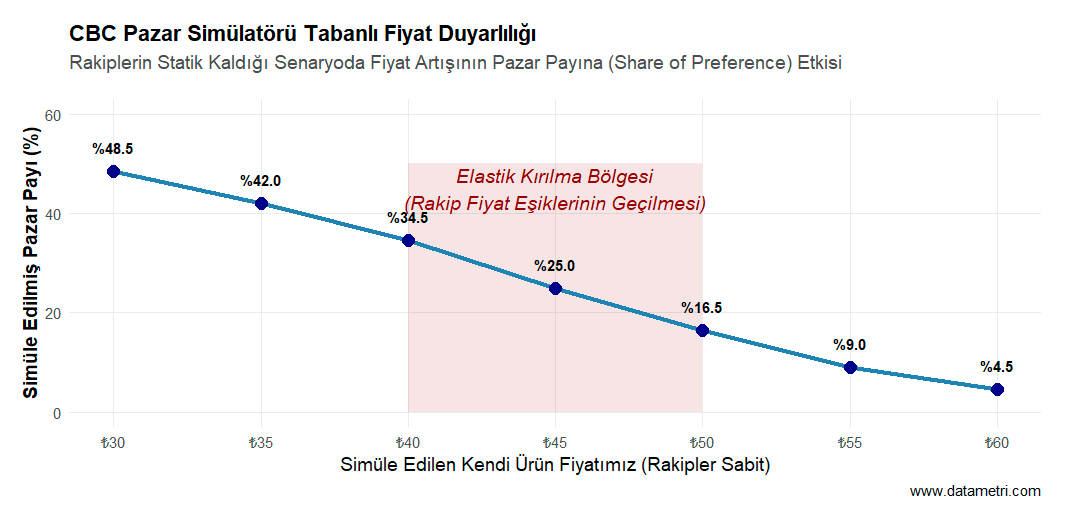
6.4. CBC Simulator-Based Dynamic Price Sensitivity Curve
The Greatest Strength That Sets This Analysis Apart
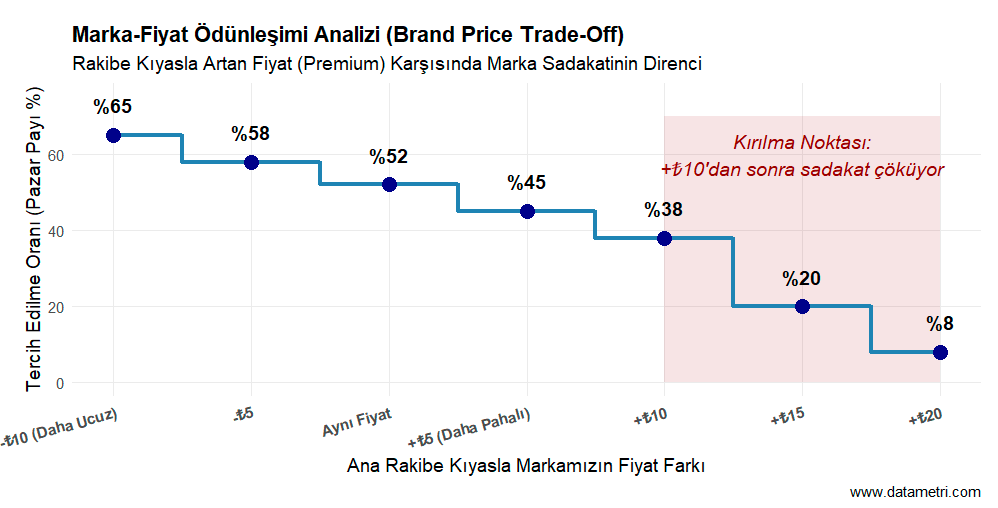
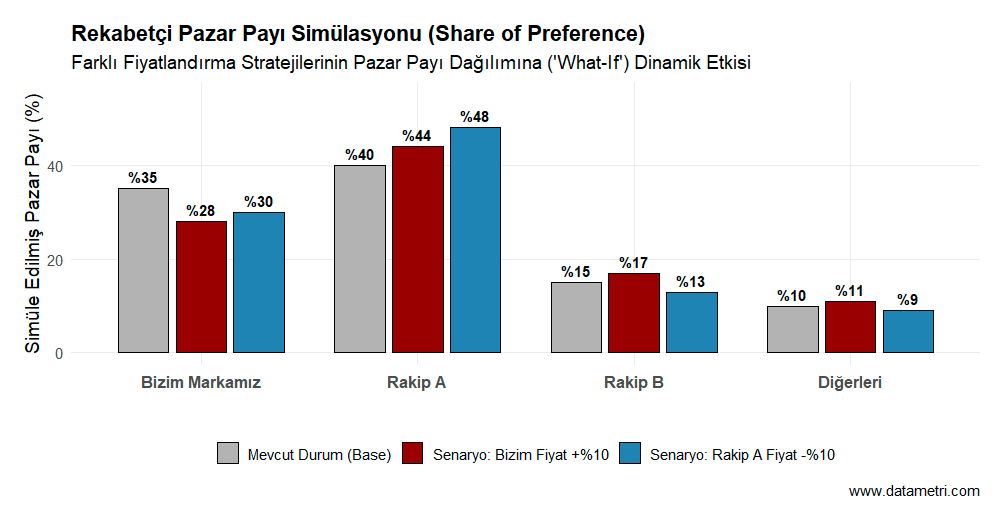
It does not measure price elasticity in a vacuum. While competitors' current product features and prices are held constant in the simulator, it draws a dynamic sensitivity curve showing how market share (Share of Preference) melts away to competitors when only your brand's price is increased.
Which Questions Does This Analysis Answer?
- Under current competitive conditions, how much can we increase our price before consumers enter the "elastic breaking" zone and suddenly start defecting to Competitor A?
Added Value to the Researcher:
- Reduces financial risks to zero in the brand's price increase strategies by simulating in advance that danger threshold where profitability is balanced by market share loss (cannibalization).