Datametri Logo
01
Advanced Kano Model and Asymmetric Penalty-Reward Analysis
Kano Model Penalty-Reward Contrast
"The Asymmetry Between the Reward of Exceeding Expectations and the Cost of Failing Them"

The "Penalty" (customer loss) caused by a poor product feature (e.g., packaging quality) and the "Reward" (customer acquisition) created by its excellence are not linear and symmetrical. Our advanced Kano modeling maps this non-linear asymmetry by testing the effect of product features on overall liking using Dummy Variable Regression.

Which Questions Does This Analysis Answer?
  • To reduce costs (COGS), which product feature can we compromise on, and which feature is absolutely "must-have"?
  • What are those basic features that consumers say are "indispensable," but do not create extra satisfaction even if they are perfect?
What Could Be the Added Value to the Researcher?
  • Return on Investment (ROI) Optimization: Prevents financial waste (over-engineering) by ensuring you allocate extra R&D budget only to "Exciting" (high Reward, low Penalty) features.
Asymmetric Penalty-Reward Analysis
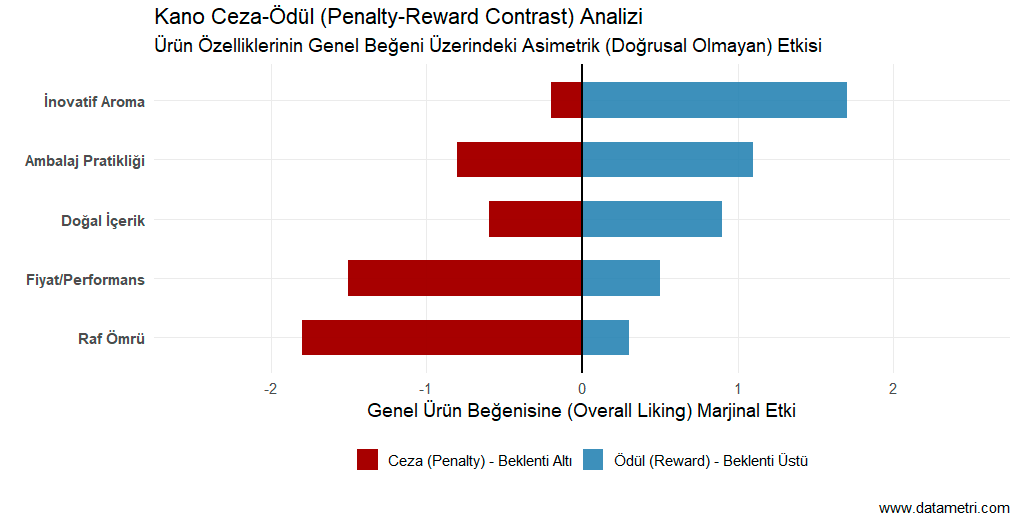
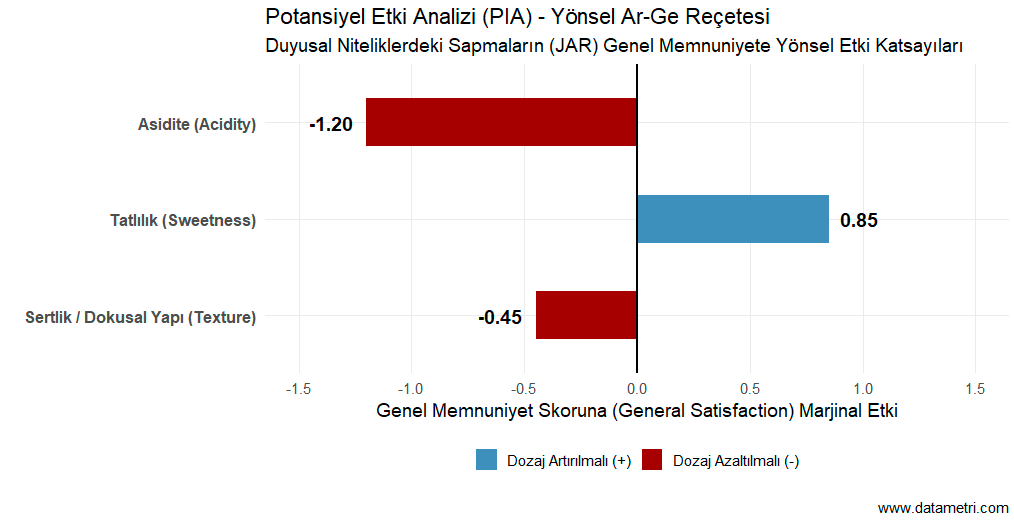
The Diverging Bar Plot in the visual decomposes the marginal effect of each feature on the "Penalty" and "Reward" axes. The red bars extending to the left show the collapse in satisfaction caused by the absence of that feature; the blue bars extending to the right show the extra value-add (wow-effect) created by the presence of the feature.
02
TURF Analysis (Total Unduplicated Reach and Frequency)
Portfolio Optimization Reach Maximization
"Combinatorial Portfolio Optimization Preventing Cannibalization"

Selecting the 5 "most popular" products (or flavors) to launch does not maximize your market reach; because the consumer base that likes these 5 popular products often overlaps. By calculating tens of thousands of possible combinations, the TURF algorithm finds the most optimal "unique product lineup" (unduplicated reach) that will reach the maximum percentage of the market without stealing each other's customers (without cannibalization).

Which Questions Does This Analysis Answer?
  • To reach 90% of the market, what is the minimum number of variants (and exactly which flavor/feature combination) do we need?
What Could Be the Added Value to the Researcher?
  • SKU Rationalization: Radically reduces clutter on production lines and inventory costs by removing unnecessary variants from the product portfolio that do not bring net sales to the market or eat into the market share of existing profitable products.
TURF Analysis Asymptotic Curve
The stepwise asymptotic curve in the visual documents the "Marginal (Additional) Reach" each new product added to the portfolio offers to the market. The point where the curve starts to flatten mathematically marks the limit of "diminishing marginal returns", where launching a new product no longer brings in new customers.
03
Sensory Penalty Analysis (JAR - Just-About-Right Scale)
Sensory Analysis Mean Drop
"The Statistical Destruction of Formulation Deviations on Overall Liking"

Especially in physical prototype and food (FMCG) testing, the fact that consumers find a feature "too sweet" or "not dense enough" (JAR deviations) is not a sufficient insight on its own. Sensory Penalty Analysis simultaneously models the size of the audience declaring these specific sensory deviations (Frequency) and the "Penalty Score" (Mean Drop) this deviation wipes from the overall product liking.

Which Questions Does This Analysis Answer?
  • Which of the dozens of minor flaws in the prototype statistically (p < .05) pulls down the purchase intent?
  • Will "reducing the salt ratio" really increase sales, or is it just the complaint of a small (marginal) audience?
What Could Be the Added Value to the Researcher?
  • Evidence-Based R&D Prescription: Provides product development (R&D) teams with a clear, statistical "formulation target" that leaves no room for guessing regarding exactly where they need to fix the product.
Strategic Sensory Penalty Map
The Strategic Sensory Penalty Map plots the percentage of consumers experiencing (complaining about) the issue on the x-axis against the severity of the drop in overall liking on the y-axis. Features falling into the upper right quadrant (e.g., "Too Salty") are "critical alarm (deal-breaker)" zones that must be sent straight back to the R&D lab.
04
Semantic Network Analysis on Open-Ended Concepts (NLP & Latent Topic Modeling)
NLP Co-occurrence
"Deciphering Hidden Connections in Consumer Responses with Natural Language Processing (NLP)"

Manually reading hundreds of pages of open-ended feedback collected about a new concept creates a human (cognitive) blindness. Using Natural Language Processing (NLP) and word co-occurrence algorithms, we transform the unstructured text responses consumers give to the concept into a mathematical Network Graph topology.

Which Questions Does This Analysis Answer?
  • Which latent topics do consumers involuntarily associate with each other when describing our new concept in their natural vocabulary?
What Could Be the Added Value to the Researcher?
  • Marketing Communication (Copywriting) Foundation: Gives advertising (Creative) agencies and brand managers exactly which keywords and emotional association clusters should be used in the launch campaign, straight from the Voice of the Customer.
NLP Semantic Network Analysis
Semantic Network Analysis, structured with radial and curved lines, visualizes the conceptual clusters in the consumer's mind. The dynamic scaling of nodes (words) according to their frequency count and the thickness of the connections between them (tie strength) take a clear empirical X-ray of the core associations the concept evokes in the consumer's brain.
05
Perceptual Product Mapping with Multiple Correspondence Analysis (MCA)
Perceptual Map Dimension Reduction
"The Exact Association of Products and Sensory Categories Through Dimension Reduction"

In categorical (non-numeric) product test data, finding out which prototype or competitor brand is identified with which specific sensory profile (e.g., "Crispy", "Classic", "Heavy") is a complex matrix analysis. Multiple Correspondence Analysis (MCA) creates a flawless "Perceptual Map" by translating multidimensional categorical (nominal) data onto a two-dimensional spatial plane.

Which Questions Does This Analysis Answer?
  • Which "sensory white spaces" do our competitors' products fill in the market, and where exactly on this matrix should our innovation (new concept) be positioned?
What Could Be the Added Value to the Researcher?
  • Strategic Positioning: Determines exactly where the new product should be positioned in a cluttered market by identifying sensory areas that are not yet claimed in the market (White Space Analysis) or where competitors are weak.
Perceptual Product Mapping (MCA)
On the Perceptual Map (Biplot), prototypes (squares) and sensory profiles (dots) are located in the same Euclidean space. The spatial proximity of a product to a specific feature is statistical proof that consumers strongly perceive that product with that sensory feature (co-occurrence).
06
Potential Impact Analysis (PIA - Directional R&D Prescription)
Dosage Optimization Regression Model
"Precise Dosage Optimizations to Maximize Overall Satisfaction"

In product tests, the contribution of each feature to satisfaction has a directional character. Our proprietary Potential Impact Analysis (PIA) algorithm calculates the regression coefficients of linear deviations in features on the Overall Liking score; making it definitively clear whether the product's feature dosages (e.g., Acidity, Hardness, Brightness) should be increased or decreased.

Which Questions Does This Analysis Answer?
  • To maximize consumer satisfaction, should we reduce the acidity in the product formula or increase the sweetness more?
What Could Be the Added Value to the Researcher?
  • Time Savings: Accelerates Time-to-Market and creates a market advantage by shortening the trial & error cycles in R&D laboratories.
Directional Impact Tornado Chart
The Directional Impact Tornado Chart breaks down the effect of sensory attributes on overall satisfaction into absolute magnitude and direction (positive/negative). Blue bars (Enhancers) express directly in R&D language that the dosage of the feature should be increased, while red bars (Detractors) indicate that the dominance of the feature must urgently be reduced.
07
Product Preference and Performance Map (3P Analysis Map)
Paired Comparison Quadrant Analysis
"Paired Comparison Tournaments and Independent Performance Index Matrix"

One of the most challenging measurements in consumer research is finding the "true competitive power" of prototypes. The 3P Model (Paired Comparison Tournament Design) pits all tested prototypes against each other in simulated matches (tournaments), calculating a "Win-Rate Preference" and cross-tabulating this with an external "Performance Index".

Which Questions Does This Analysis Answer?
  • Why is our product, which has the highest performance metrics (taste, smell) in laboratory tests, not preferred by the consumer against the competitor in a real competitive environment?
What Could Be the Added Value to the Researcher?
  • Product Launch Decision (Go/No-Go): Prevents commercial fiascos by approving the launch of only those prototypes located in the "Stars" quadrant, which have both high sensory performance and beat their competitors in the consumer preference tournament.
3P Model Strategic Quadrant Chart
The Strategic Quadrant Map divides prototypes into four vital (categorical) zones: "Stars", "Hidden Threat", "Niche Potential", and "Weak Link". This view clearly reveals why a product with high engineering performance has a low "win" rate in the eyes of the consumer (or vice versa).

Let's Simulate Your Product Innovation with Algorithms

Contact us to test your prototypes or new product concepts in the R&D process according to the true (irrational) dynamics of the market and to assimilate the risk.