01
Normality Assumption Audit
▼
Most parametric tests (t-test, Pearson, ANOVA) rely on the assumption that the dependent variable exhibits a normal distribution in the population (Gaussian Distribution). Violation of this assumption distorts the standard error margins of the test statistics (t, F, Z).
- Analytical Approach: Depending on the sample size, Shapiro-Wilk (n < 50) or Kolmogorov-Smirnov (n > 50) tests are applied. It is verified whether Kurtosis and Skewness coefficients are within the ± 1.5 range.
- Visual Assessment: The conformity of the data to the normal distribution line is examined microscopically via Q-Q Plot curves.
Which Questions Does This Analysis Answer?
- Analytical Confidence: Does the data possess the mathematical symmetry capable of supporting parametric tests (like ANOVA)?
- Test Decision: Due to the skewness of the distribution, would it be a more scientific approach to report my results using Non-Parametric tests (like Kruskal-Wallis) based on the median?
Added Value to Your Research
Reviewers for high-impact factor (Q1) journals are not convinced by the mere statement "normality was tested." Including the Q-Q plot and its interpretation in the methodology section elevates the "Statistical Rigor" level of your study to the maximum.
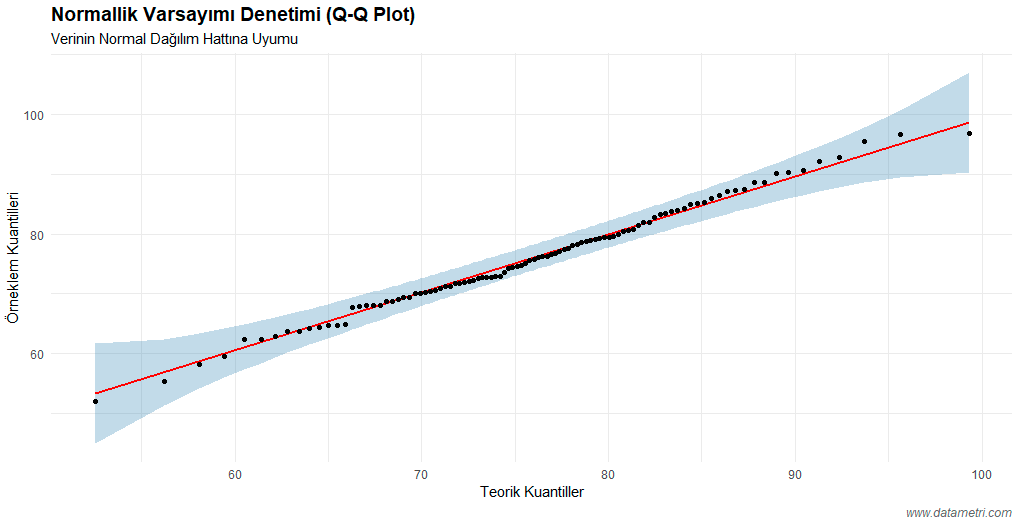
The Q-Q (Quantile-Quantile) plot is an auditing tool that compares the quantiles of your sample data with the quantiles of a theoretical normal distribution. The red line represents the ideal normality line; the blue area represents the 95% confidence bands. The observed points remaining within this band prove that the deviation from normality is not statistically significant (p > 0.05).