Datametri Logo
01
Exploratory Segmentation: Hierarchical Clustering (Ward's Method)
Hierarchical Clustering Dendrogram
"Map the Natural Breakdowns and Genetic Hierarchy of the Consumer Base"

Instead of imposing a predetermined, artificial number of segments (k) onto the segmentation process, we leave the dataset to its own devices to seek out its natural breakdowns. Operating with an Agglomerative approach, our Hierarchical Clustering algorithm treats each customer as a single cell and gradually merges the most similar ones by calculating the Euclidean distances between them.

Which Questions Does This Analysis Answer?
  • Without forced assumptions, how many main customer clusters naturally emerge from the inherent structure of the data in our market?
What Could Be the Added Value to the Researcher?
  • Places management within a scientific framework by basing the "number of segments" upon which the marketing strategy will be built on statistical distances, rather than instincts.
Hierarchical Clustering Dendrogram
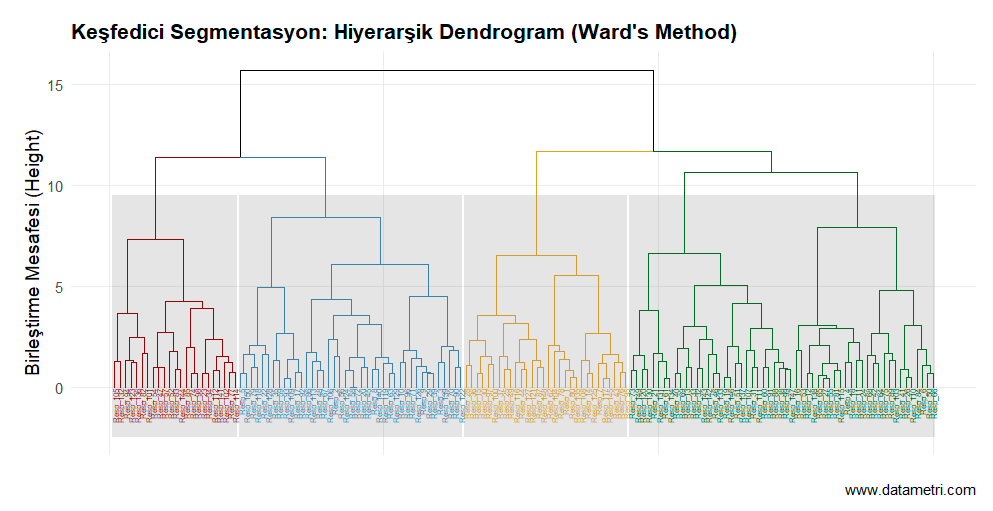
The Hierarchical Dendrogram documents the branching of the customer base like a genetic family tree. Using Ward's Method, intra-cluster variance increase is minimized, and how the market diverges from the main body into distinct colors (the optimum k point) is topologically proven.
02
Deterministic Segmentation: K-Means Optimization and Convex Hulls
K-Means PCA Convex Hulls
"Maximizing Intra-Cluster Homogeneity in Big Data Sets"

Based on the optimum number of clusters (k) discovered in the hierarchical model, we deploy K-Means optimization to divide the data along its sharpest lines. This algorithm iteratively scans massive transactional data in databases; optimizing cluster centers (centroids) to be as far apart from each other as possible, while keeping cluster members as close to the center as possible (minimum sum of squares).

Which Questions Does This Analysis Answer?
  • Into which specific transactional and loyalty groups are the customers in our database mathematically divided?
So What is the Added Value to the Researcher?
  • Creates distinct, non-overlapping, and actionable target audiences that can be directly integrated into Customer Relationship Management (CRM) automations.
K-Means PCA and Convex Hulls
Dimensions are reduced via Principal Component Analysis (PCA), and each consumer is assigned to their respective segment. Convex Hulls wrapping the clusters visualize the strict boundaries between segments, their intersection points, and the spatial distribution (variance) of the market.
03
Probabilistic (Fuzzy) Segmentation: Gaussian Mixture Models (GMM)
GMM Probabilistic
"Modeling 'Probabilities of Belonging' Instead of Rigid Assignments to Clusters"

Traditional clustering analyses (like K-Means) trap customers in rigid boxes. However, in real life, a consumer can be both "Price-Oriented" and partially a "Premium Seeker". Using Finite Mixture Models, GMM calculates the probability of individuals belonging to a specific segment (Posterior Probability) and deciphers the true smooth distribution underlying the data.

Which Questions Does This Analysis Answer?
  • Who are the consumers remaining in the market's "gray areas", showing a tendency to drift into multiple segments (and thus carrying a churn risk)?
What Could Be the Added Value to the Researcher?
  • By establishing transitive targeting strategies, it precisely identifies customers holding the potential (upsell/cross-sell) to be promoted from one segment to another.
Gaussian Mixture Models Probability Density
Probability density ellipses representing areas of likelihood document that the market separates not with strict lines, but with intertwined clouds of probability. The size and transparency (alpha) of the points dynamically reflect the high probability with which the customer belongs to that core mindset.
04
Topological Segmentation with Artificial Neural Networks: Self-Organizing Maps (SOM)
Kohonen Networks Neural Networks
"Organic Two-Dimensional Mapping of Multidimensional Customer Data via Kohonen Networks"

Classical algorithms collapse in complex data containing dozens of variables. Inspired by the visual cortex of the human brain, SOM (Kohonen Networks) takes 50 different variables via unsupervised deep learning algorithms and reduces them to a two-dimensional neural grid without distorting the topological structure of the market.

Which Questions Does This Analysis Answer?
  • How do dozens of seemingly disconnected attitudinal variables organically form a topological map in the consumer's mind?
What Could Be the Added Value to the Researcher?
  • Beyond macro-segmentation, it offers micro-targeting capabilities by discovering the "micro-clusters" within the market and the neighborhood relationships between them.
Self-Organizing Maps (SOM) Topological Map
This neural network map in a Grid structure topologically places the most similar consumer profiles into neighboring cells (neurons). While colors indicate main segments, the transparency of the cells shows the customer density within that neuron using heatmap logic.
05
Density-Based Clustering: DBSCAN and Noise Isolation
DBSCAN Outlier Isolation
"Exclusion of Anomalous Responses (Noise) and Discovery of Non-Linear Clusters"

Most algorithms corrupt the analytical DNA of an entire segment by forcibly including participants who give inconsistent responses or are nowadays referred to as "trolls" into a cluster. The DBSCAN algorithm scans the data according to its spatial density and isolates insufficiently dense outliers as "Noise," thereby clustering only the "true" masses of the market.

Which Questions Does This Analysis Answer?
  • When we filter out the pollution in our CRM database and the asymmetrical responses in surveys, what are the remaining "pure and healthy" market clusters?
What Could Be the Added Value to the Researcher?
  • Dramatically increases the general validity and commercial accuracy of segmentation models by excluding outliers that manipulate data quality.
DBSCAN Density-Based Clustering
The large and colored dots in the graph represent the dense Core Clusters that form the backbone of the market. The small black crosses scattered around are inconsistent/outlier customer profiles (Noise) that our algorithm has detected and excluded from the analysis.
06
Sociometric Segmentation: Social Network Analysis and Community Detection (SNA)
SNA Louvain Algorithm
"Deciphering Organic Echo Chambers and Key Opinion Leaders via Network Analysis"

Even if people are in the same demographic group, they behave differently if they are not within the same social Network. Our Louvain Community Detection algorithm looks at interactions among consumers or B2B institutions to detect "Tightly-Knit Communities" on the network and the "Key Opinion Leaders" (Hubs) governing these groups.

Which Questions Does This Analysis Answer?
  • To trigger sub-communities in the market and initiate viral (Word-of-Mouth) spread, which key audience (Hub) is sufficient for us to convince?
What Could Be the Added Value to the Researcher?
  • Instead of spreading the marketing budget across the entire audience, it exponentially increases marketing ROI by focusing on the key opinion leaders (influencers) at the center of communities.
Social Network Analysis (SNA) and Key Opinion Leaders
The Social Network (SNA) Graph shows the organic ties (edges) connecting consumers (nodes) and color-coded echo chambers. The massive-sized nodes are the actors with the highest "Central Influence Power" (Degree Centrality) that steer the decisions of that community.
07
Psychometric Mindset Clustering: Q-Methodology
Q-Sort Reverse Factor
"Reverse Factor Analysis Based on Shared Statement Systems, Not Demographics"

A market does not consist solely of demographics; it is comprised of different "Worldviews". With Q-Methodology, we invert the data matrix and subject "people" to factor analysis, rather than variables. This approach maps the fundamental mindset paradigms within the market based on the statements they reject and endorse.

Which Questions Does This Analysis Answer?
  • What are the deepest belief systems, paradigms, and mental barriers driving our consumers' purchasing behavior?
What Could Be the Added Value to the Researcher?
  • Allows you to rebuild the brand's Tone of Voice (Psychographic Targeting) directly with the words and value judgments used by these mindset paradigms.
Q-Methodology Z-Score Graph
The Diverging Z-Score Graph asymmetrically ranks the distinguishing statements defining a specific mindset (e.g., Conscious Innovators). The blue bars extending to the right represent the values that segment firmly believes in; the red bars extending to the left represent the ideas they fiercely reject.
08
Archetypal Analysis and Psychological Positioning
Archetypes Simplex Space
"Discovering 'Pure Archetypes' Representing the Extreme Edges of the Market, Instead of Averages"

Standard algorithms roughly find the "average" of clusters; but an average profile is generally very unappealing from a marketing standpoint. Archetypal Analysis, an adaptation of Carl Jung's archetype theory to data science, seeks the outer limits of the market, not its center. It finds the most extreme "Pure Archetypes" and calculates what percentage of the entire market is a composition of these archetypes.

Which Questions Does This Analysis Answer?
  • How can we position our brand according to the most extreme "pure psychological profile" that will drag masses behind it, rather than according to a dull and "average" segment?
What Could Be the Added Value to the Researcher?
  • Provides marketing and communication teams with inspiring and clearly bounded brand personas (Archetypes) so they can create powerful Storytelling.
Archetypal Analysis Simplex Space
In the Simplex (Triangular Space) graph, the corners represent 3 pure archetypes defining the psychological boundaries of the market. The blue dots in the middle (consumers) are distributed between these 3 extremes with Barycentric (center of mass) coordinates. This topology clearly shows towards which archetype the market's center of gravity is shifting.
09
Perceptual Mapping with Correspondence Analysis (CA)
Biplot Perceptual Map
"Matching Brands and Image Adjectives in the Same Space"

While MDS maps only measure the distance between brands, Correspondence Analysis (CA) shows "why" they are similar or divergent. Operating via Chi-square statistics, this model takes an asymmetrical X-ray of perception by placing both "Brands" and "Image Adjectives" (e.g., Reliable, Expensive, Innovative) into the same two-dimensional space.

Which Questions Does This Analysis Answer?
  • Exactly which words and adjectives (images) are stuck to our brand and our competitors in the consumer's mind? What is the spatial chasm between the perception we want to own and the current perception?
What Could Be the Added Value to the Researcher?
  • Offers opportunities for Brand Repositioning by identifying image areas (White Space) where competitors are weak.
Correspondence Analysis Perceptual Map
In the Correspondence Analysis (Biplot) graph, brands (squares) and image adjectives (dots) reside together. The spatial proximity of Brand "X" to the "Innovative" adjective is proof that in the consumer's mind, that brand is inextricably paired (statistically significant co-occurrence) with this adjective.

Let's Decode the Hidden DNA of Your Target Audience

Contact us to split the customers in your database with algorithms, map organic segments, and position your brand in an unrivaled space.