Datametri Logo
01
Strategic Decision Making and Stochastic Vision for Boards of Directors (C-Level Data Literacy)
C-Level Training Stochastic Decisions

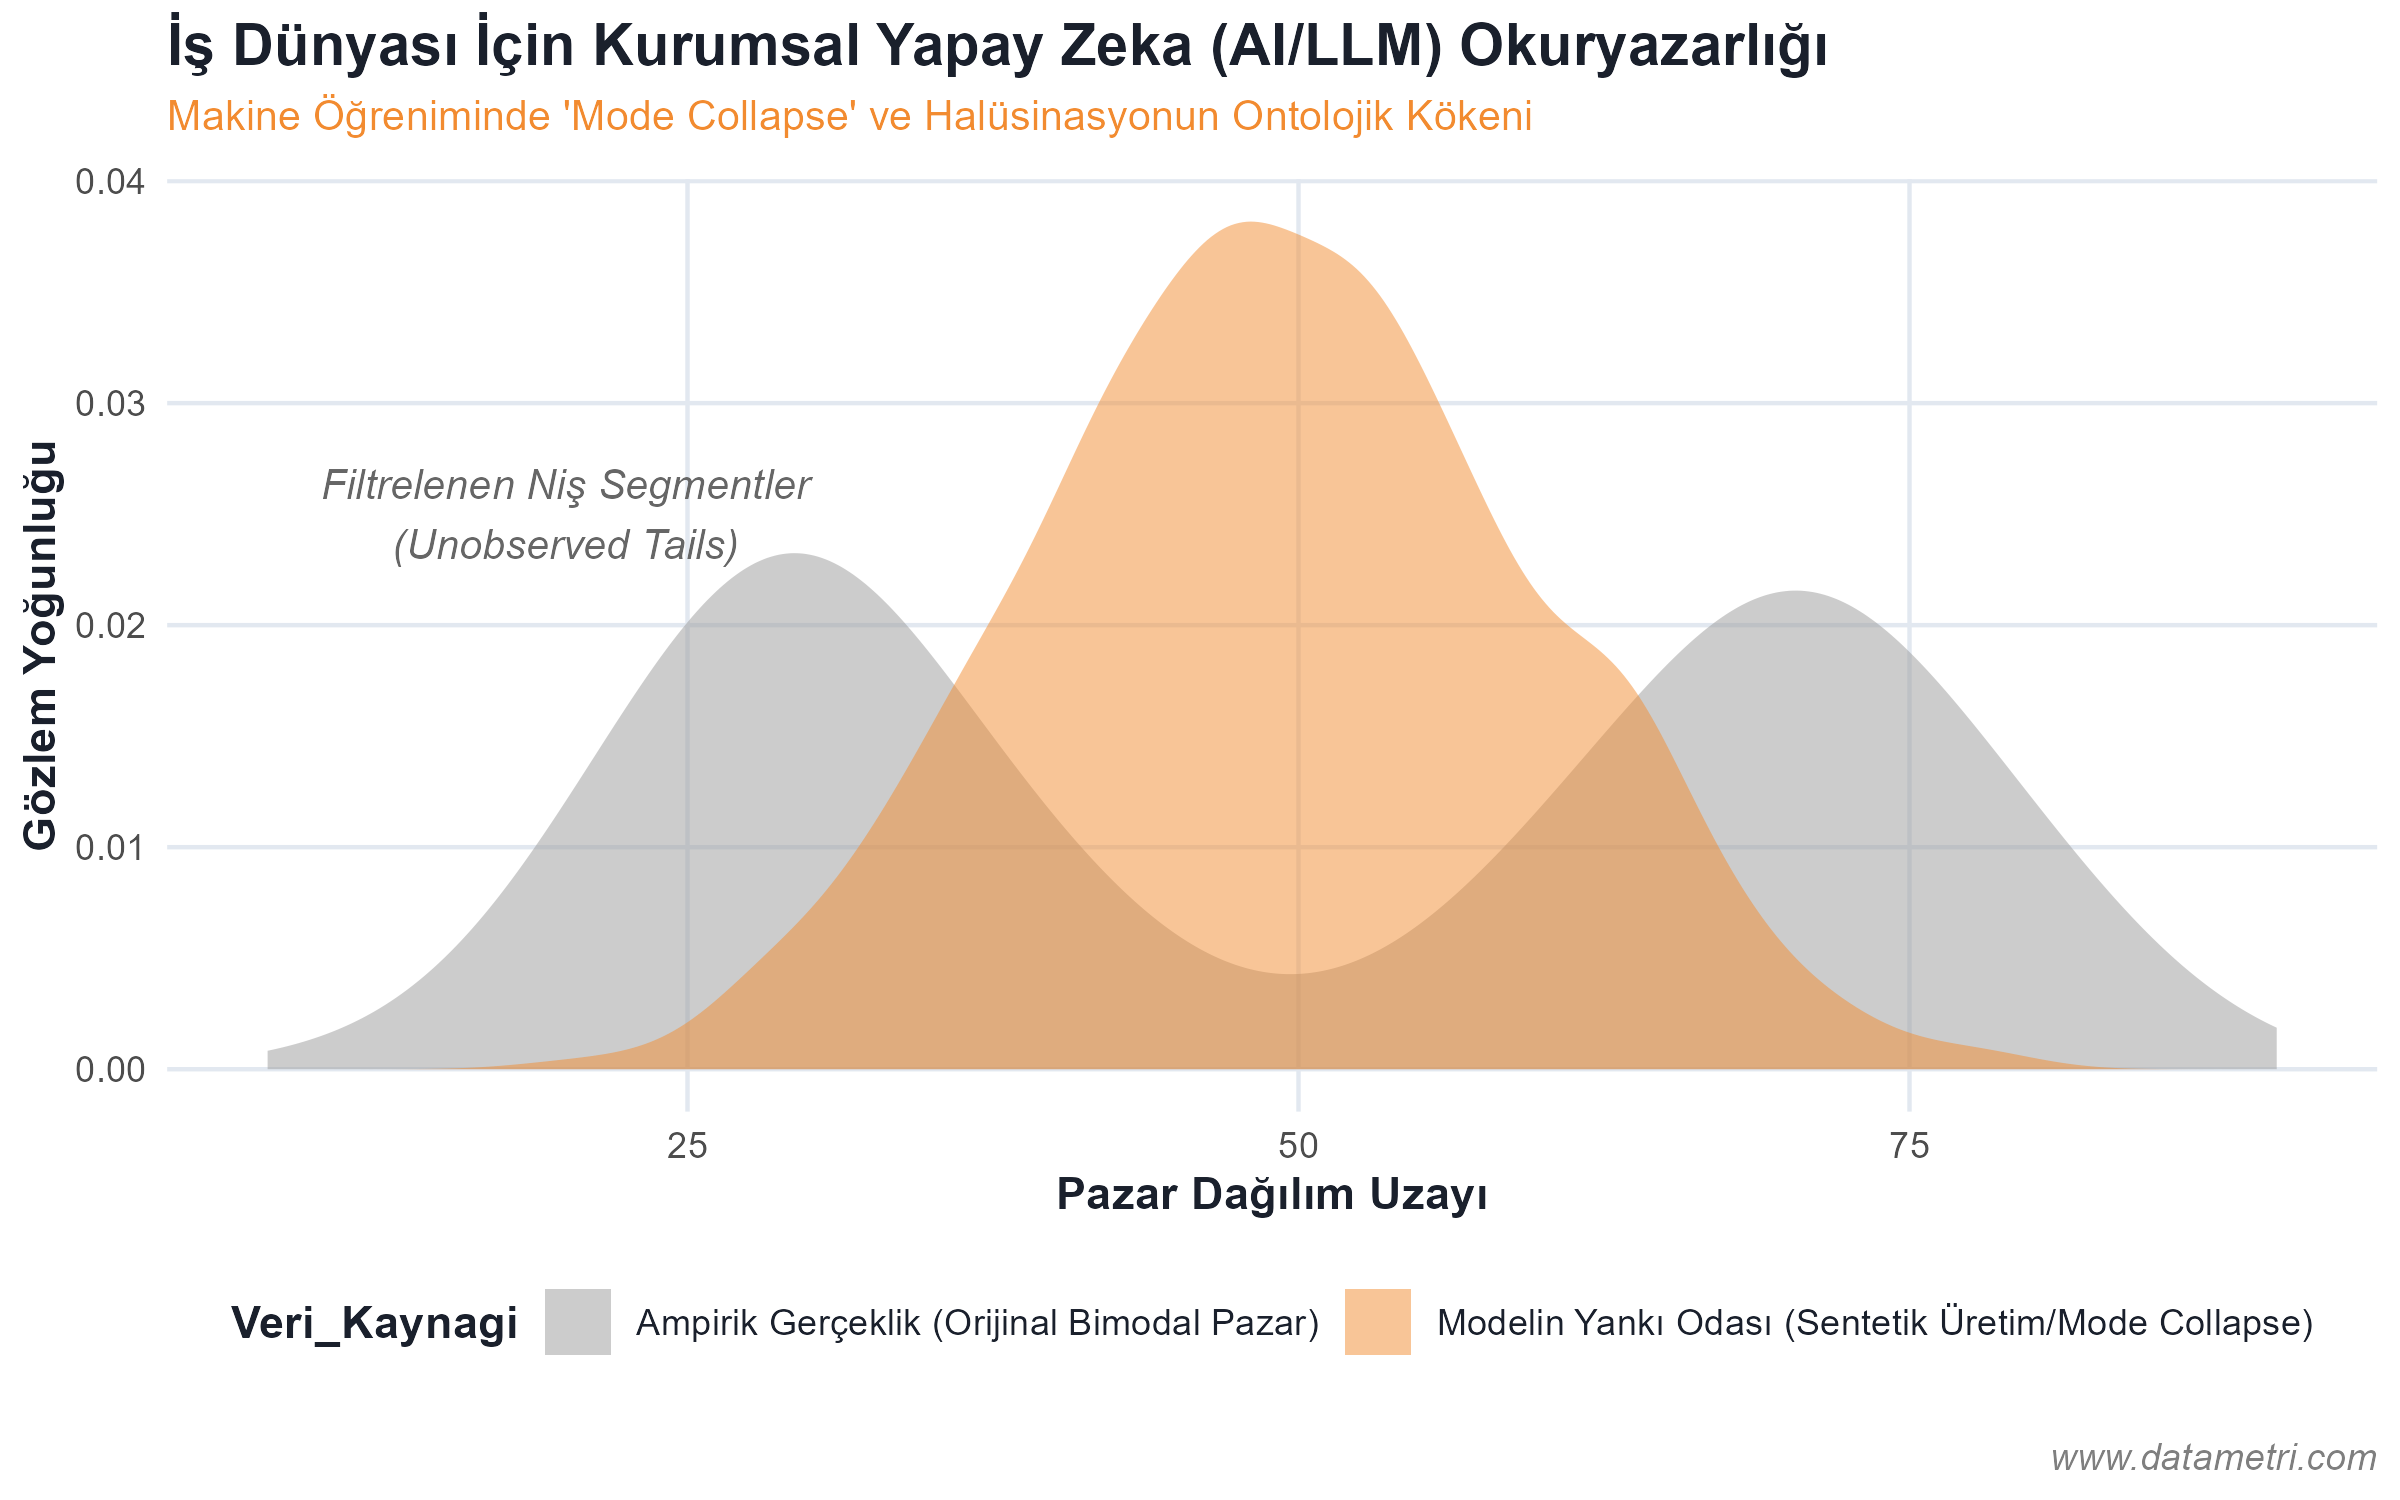
Top-level executives (CEO, CMO, CFO) are not expected to write technical algorithms; however, their ability to audit the epistemological limits and variance levels of the analytical models presented to them is a strategic necessity. This module aims for decision-makers to break free from deterministic fallacies and manage risk and uncertainty within a probabilistic framework.

Training Curriculum and Academic Outcomes:
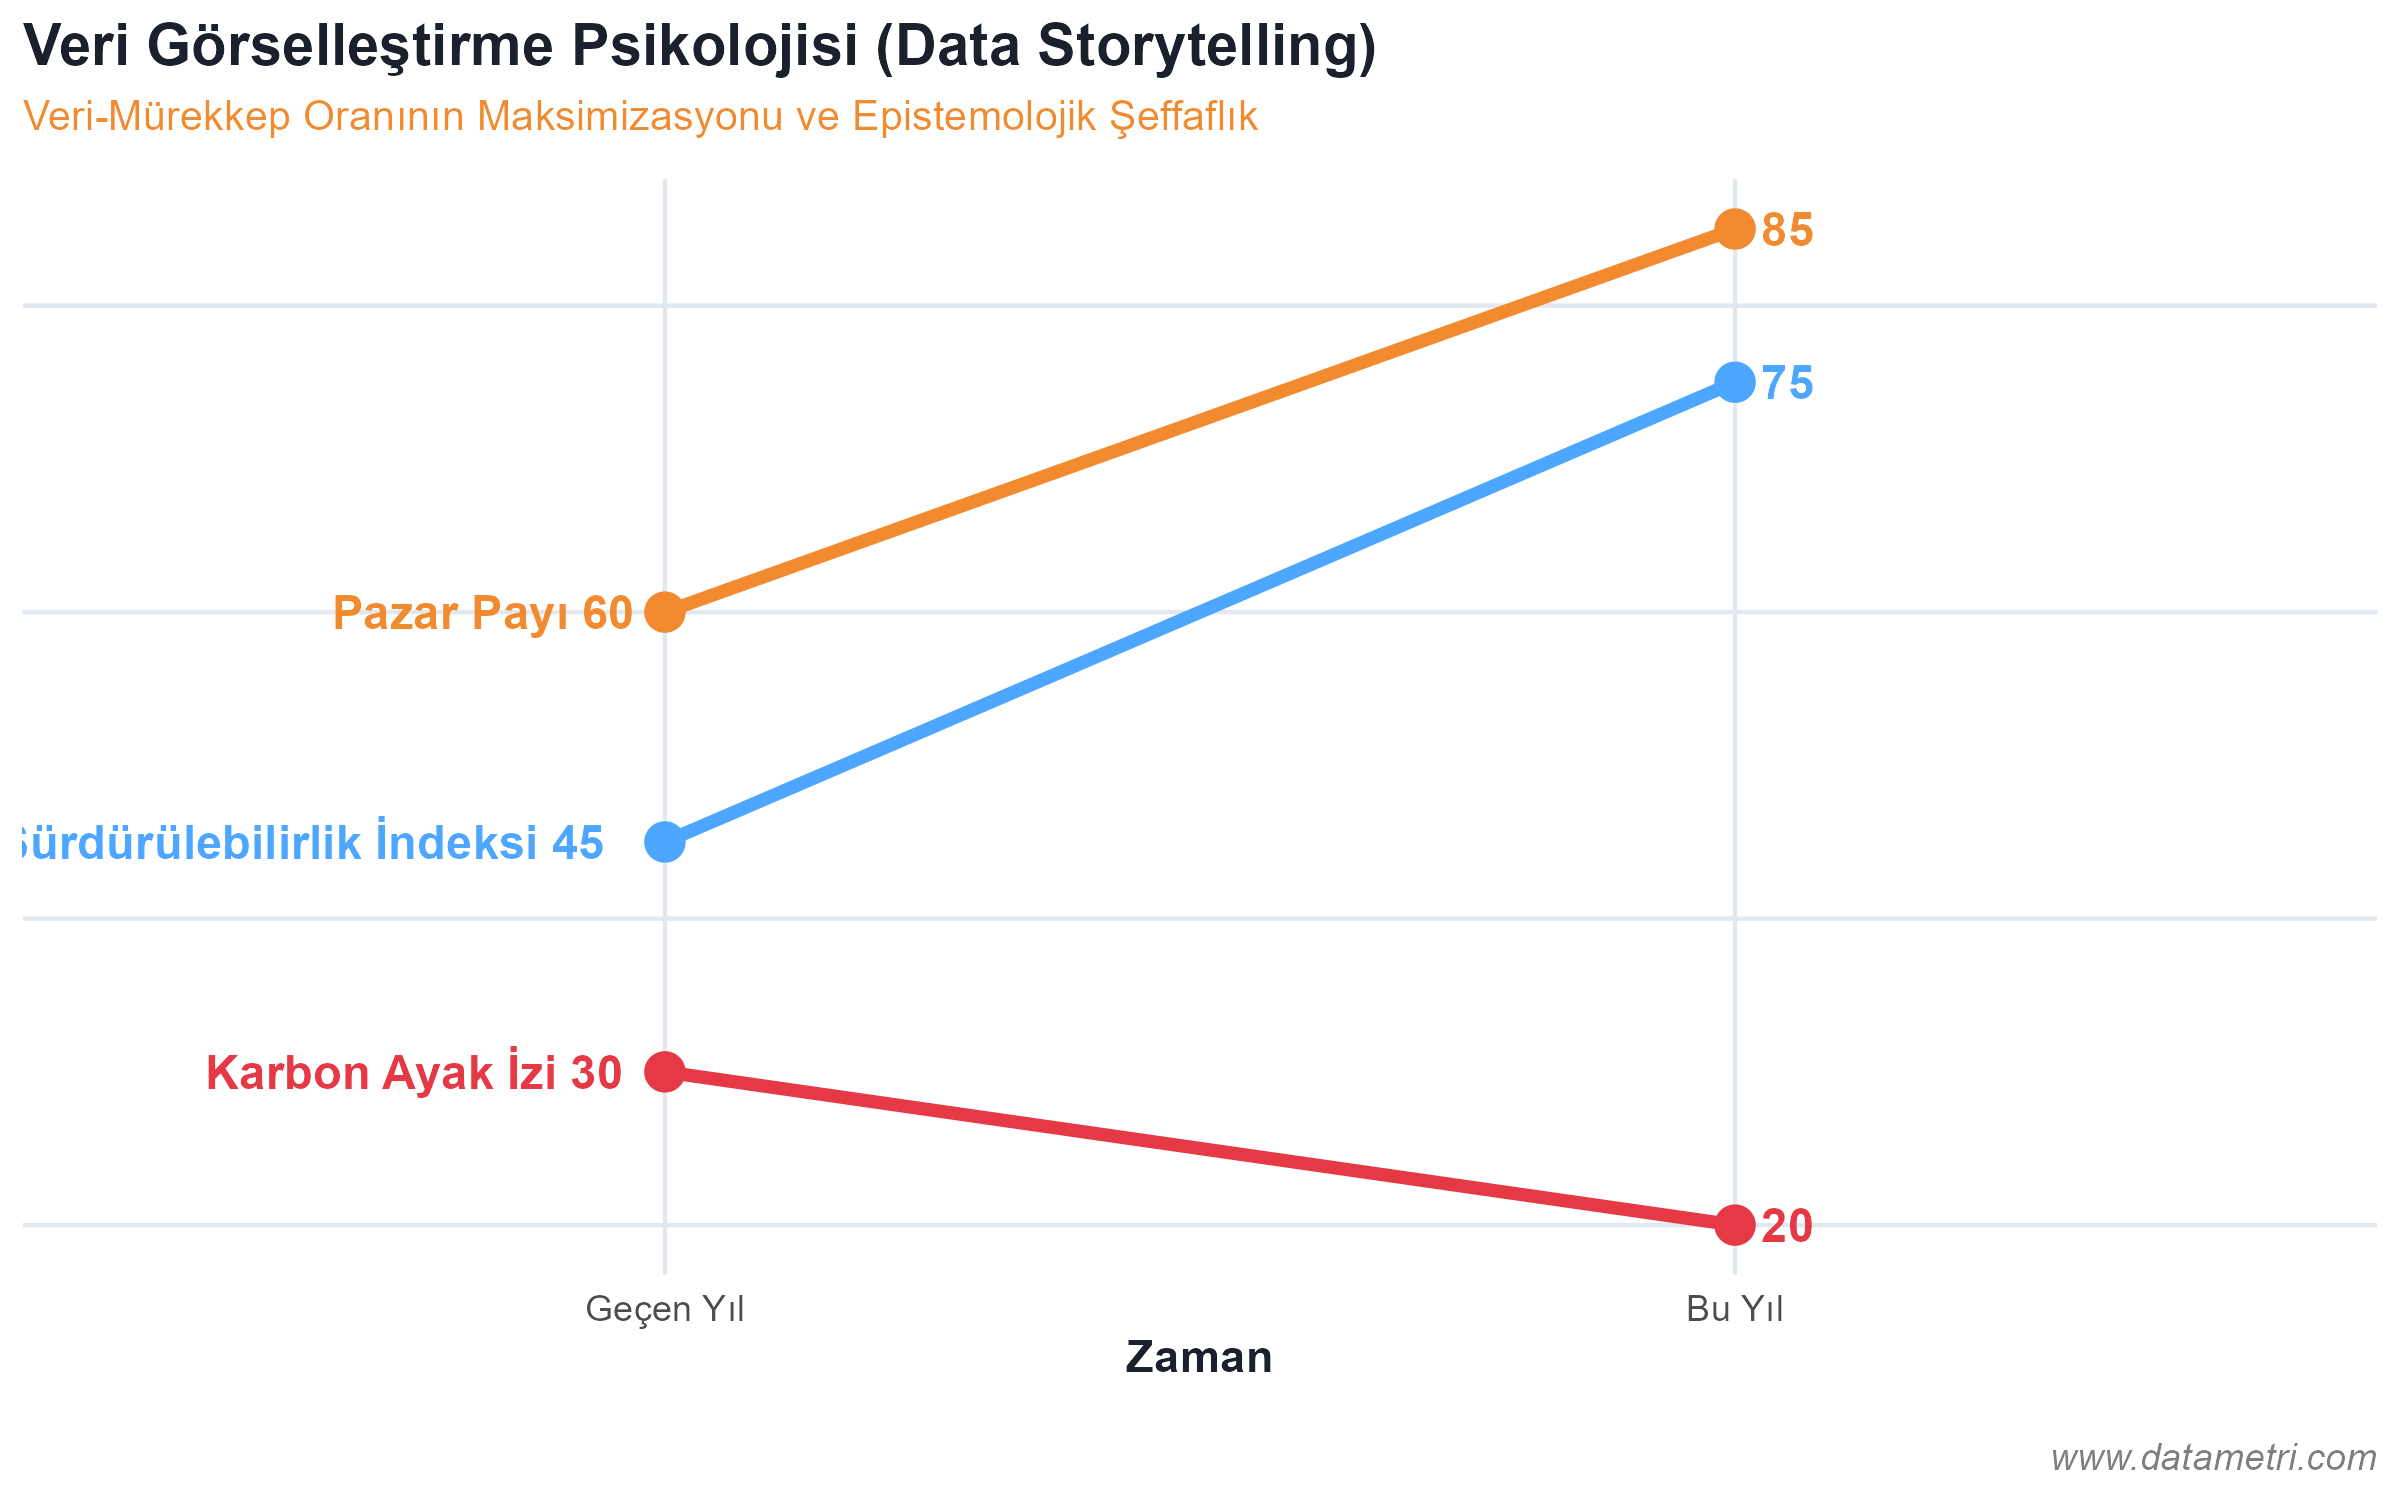
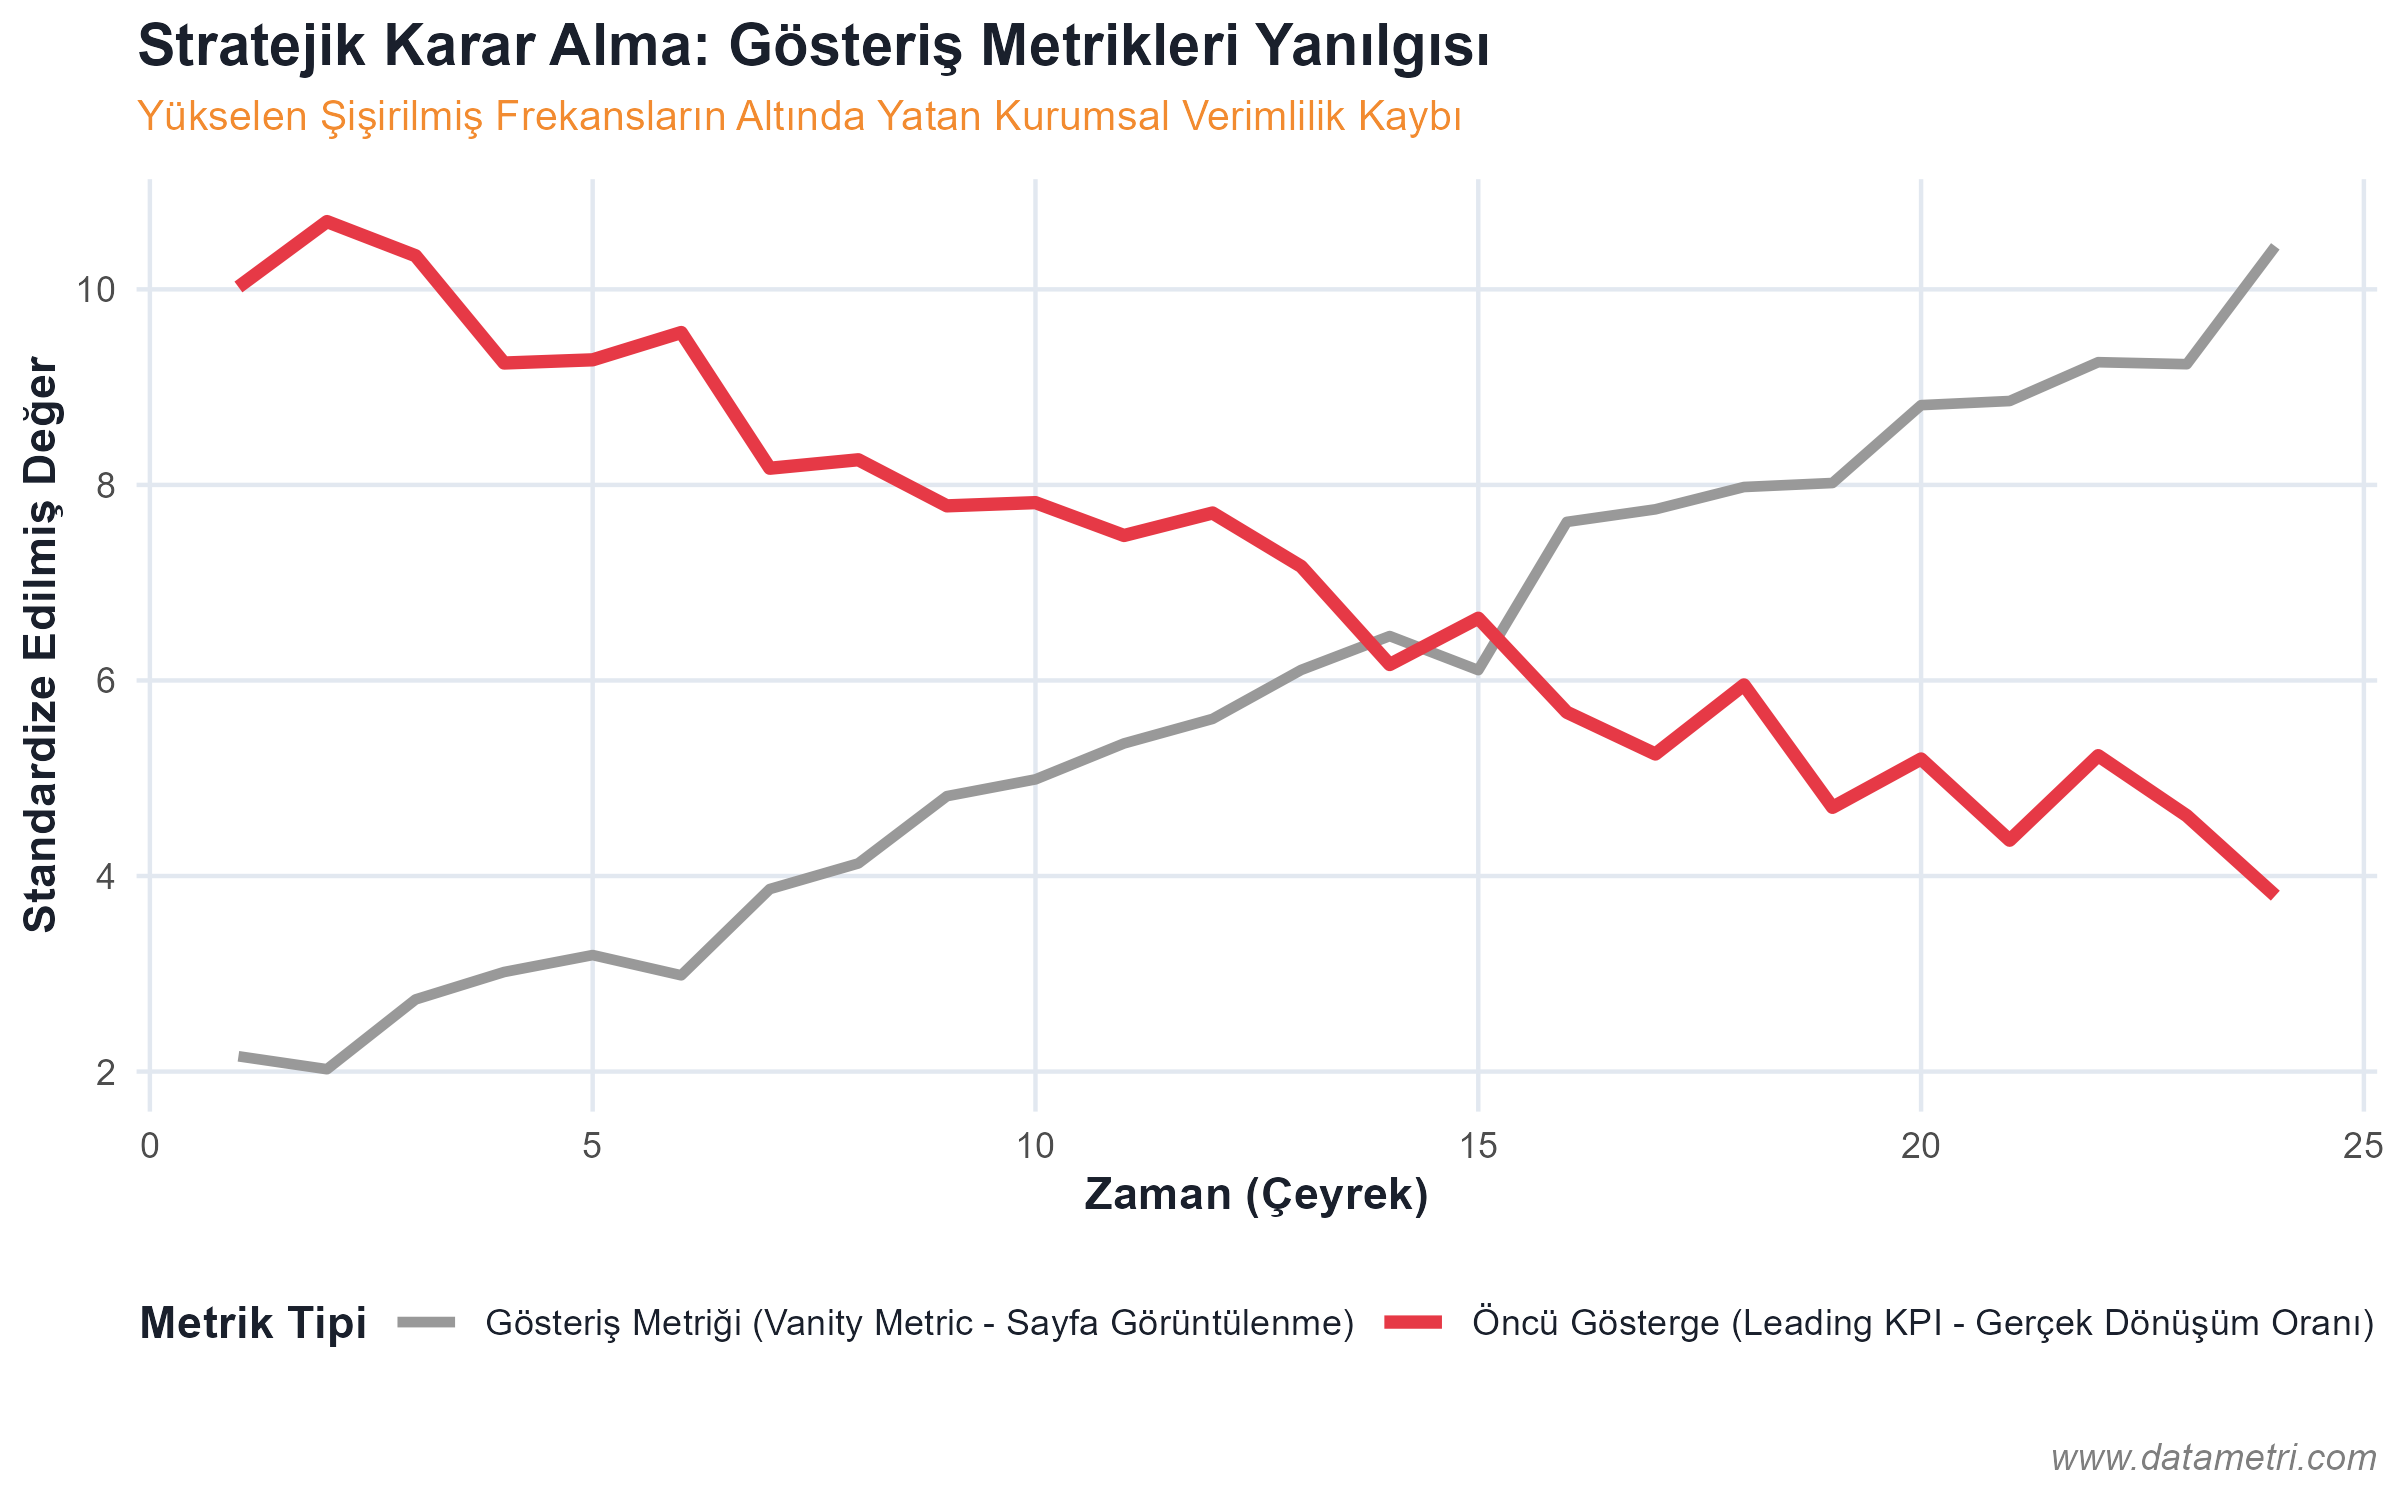
  • Isolation of Spurious Metrics: Rejecting Vanity Metrics that have no Predictive Validity, such as page views. The integration of "Leading Indicators" capable of generating causal action into the system instead.
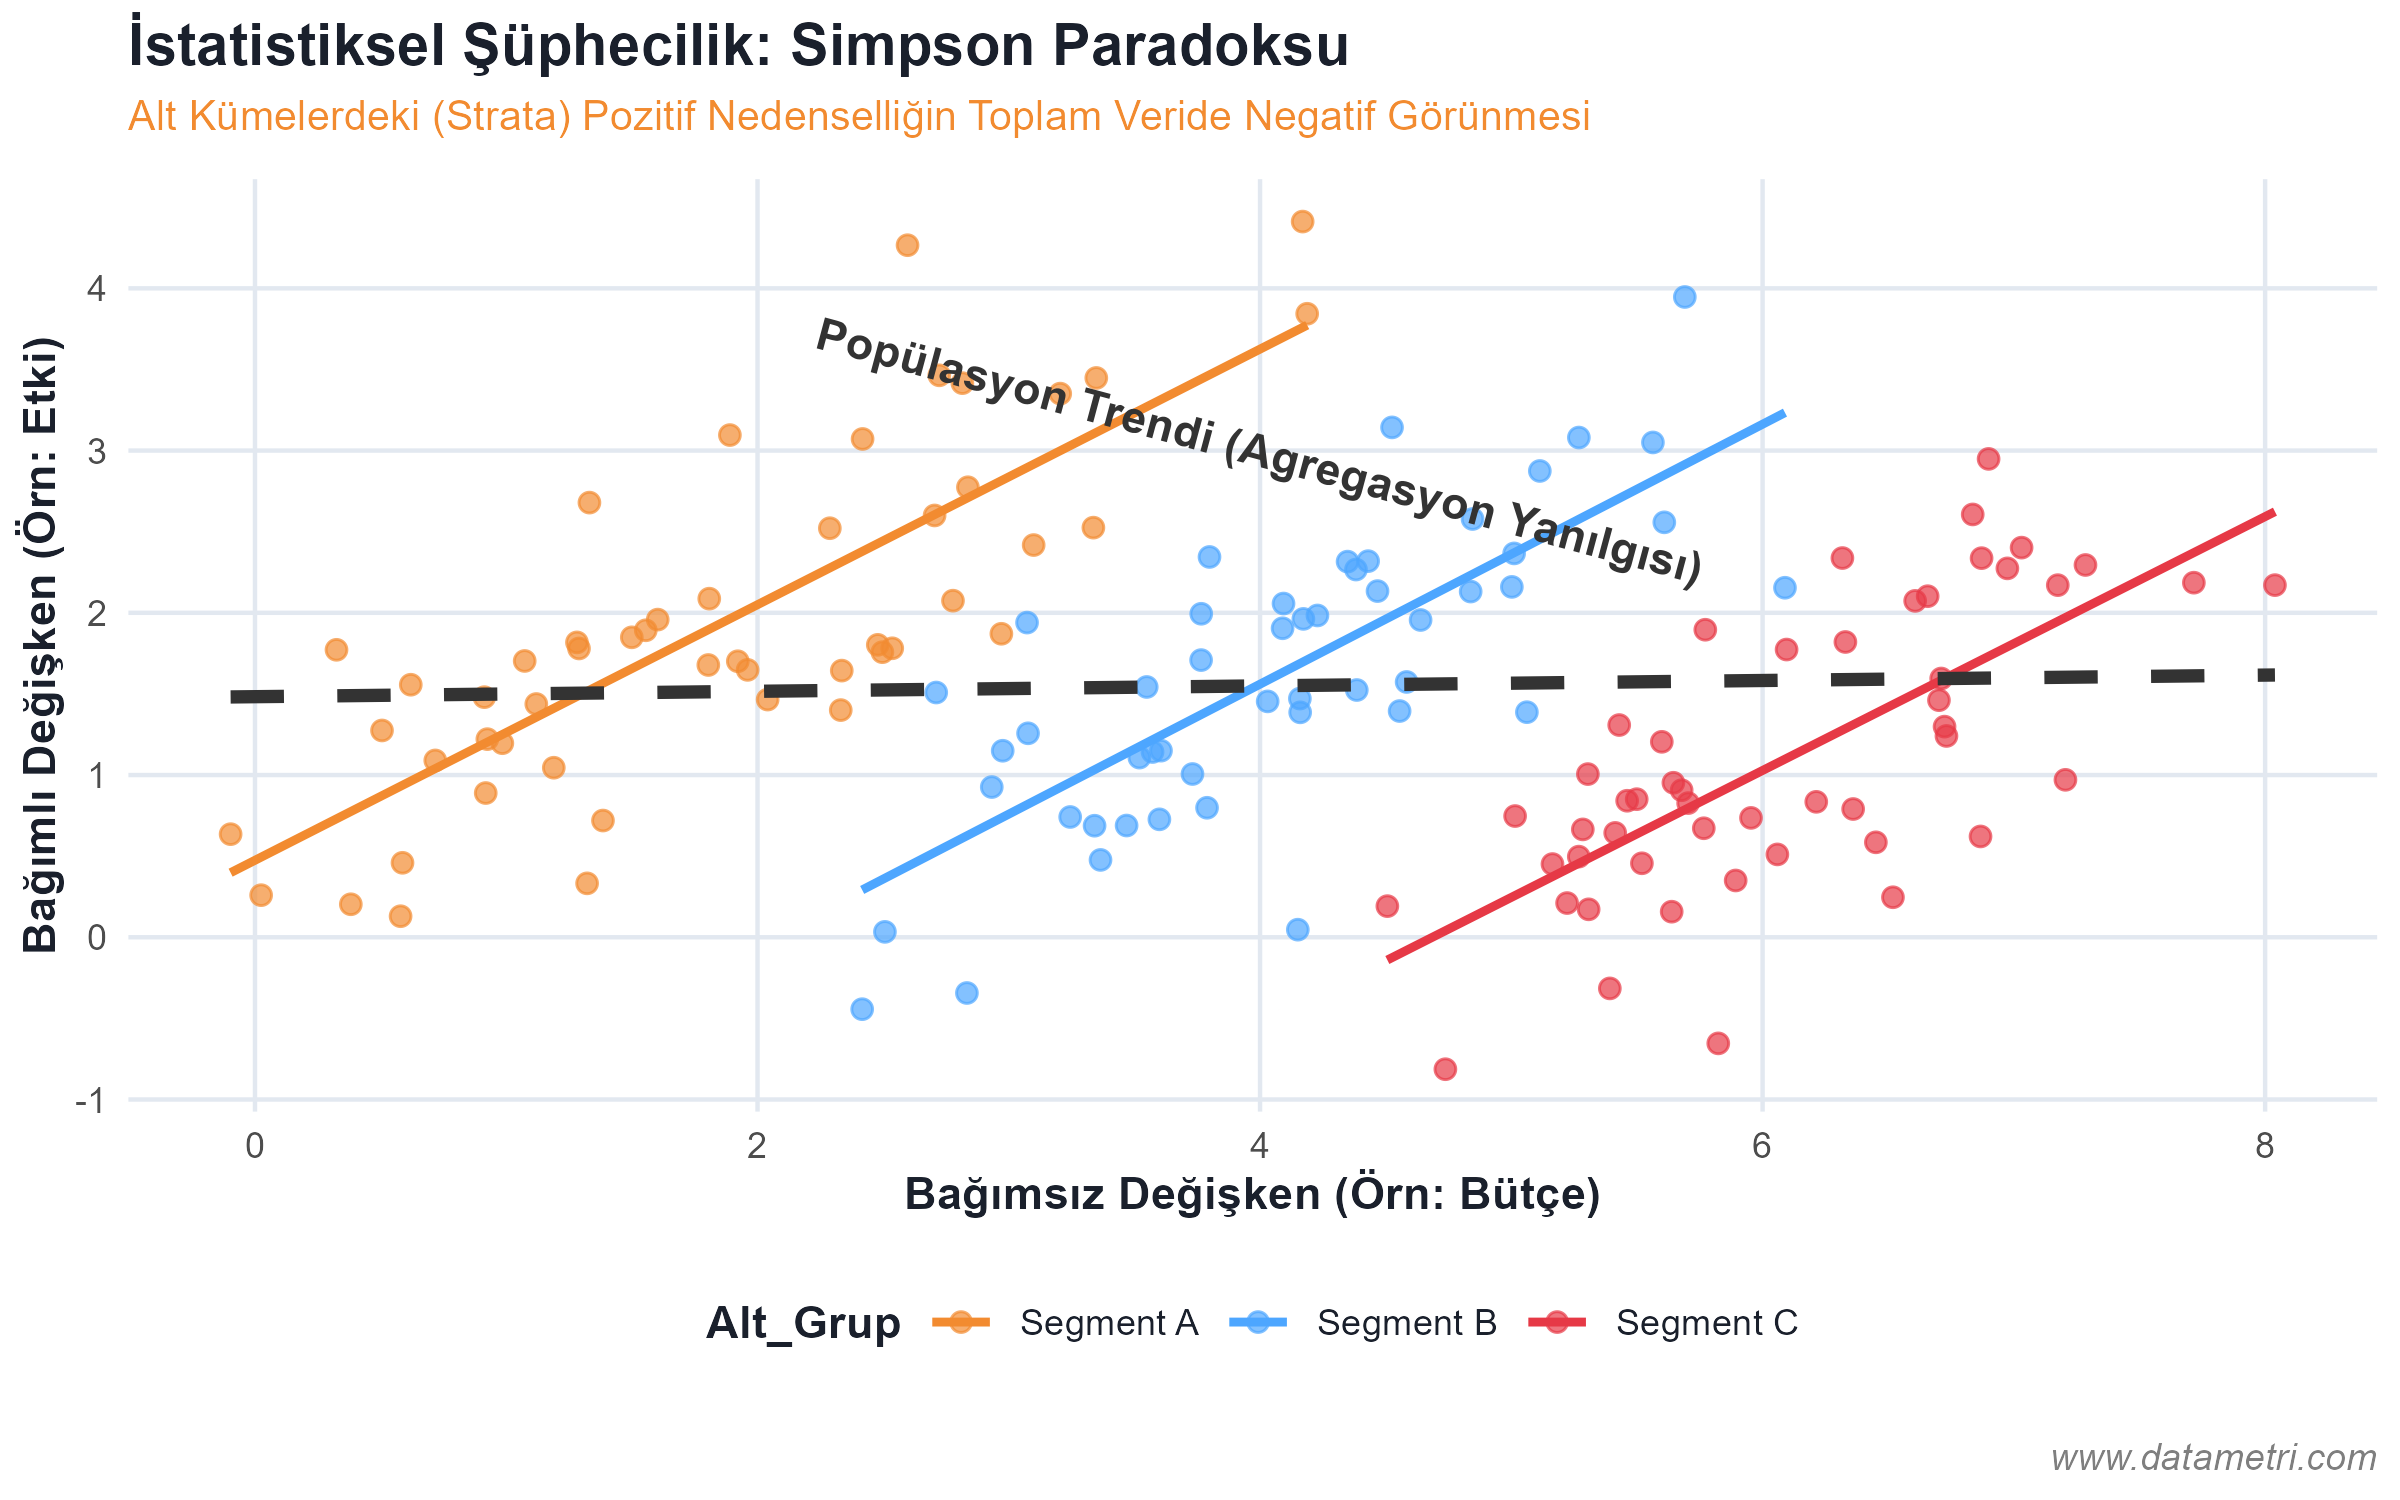
  • Causality and Correlation Asymmetry: Detecting spurious correlations between two variables moving simultaneously; the competency to demand data teams to purge Exogenous Confounders from the model.
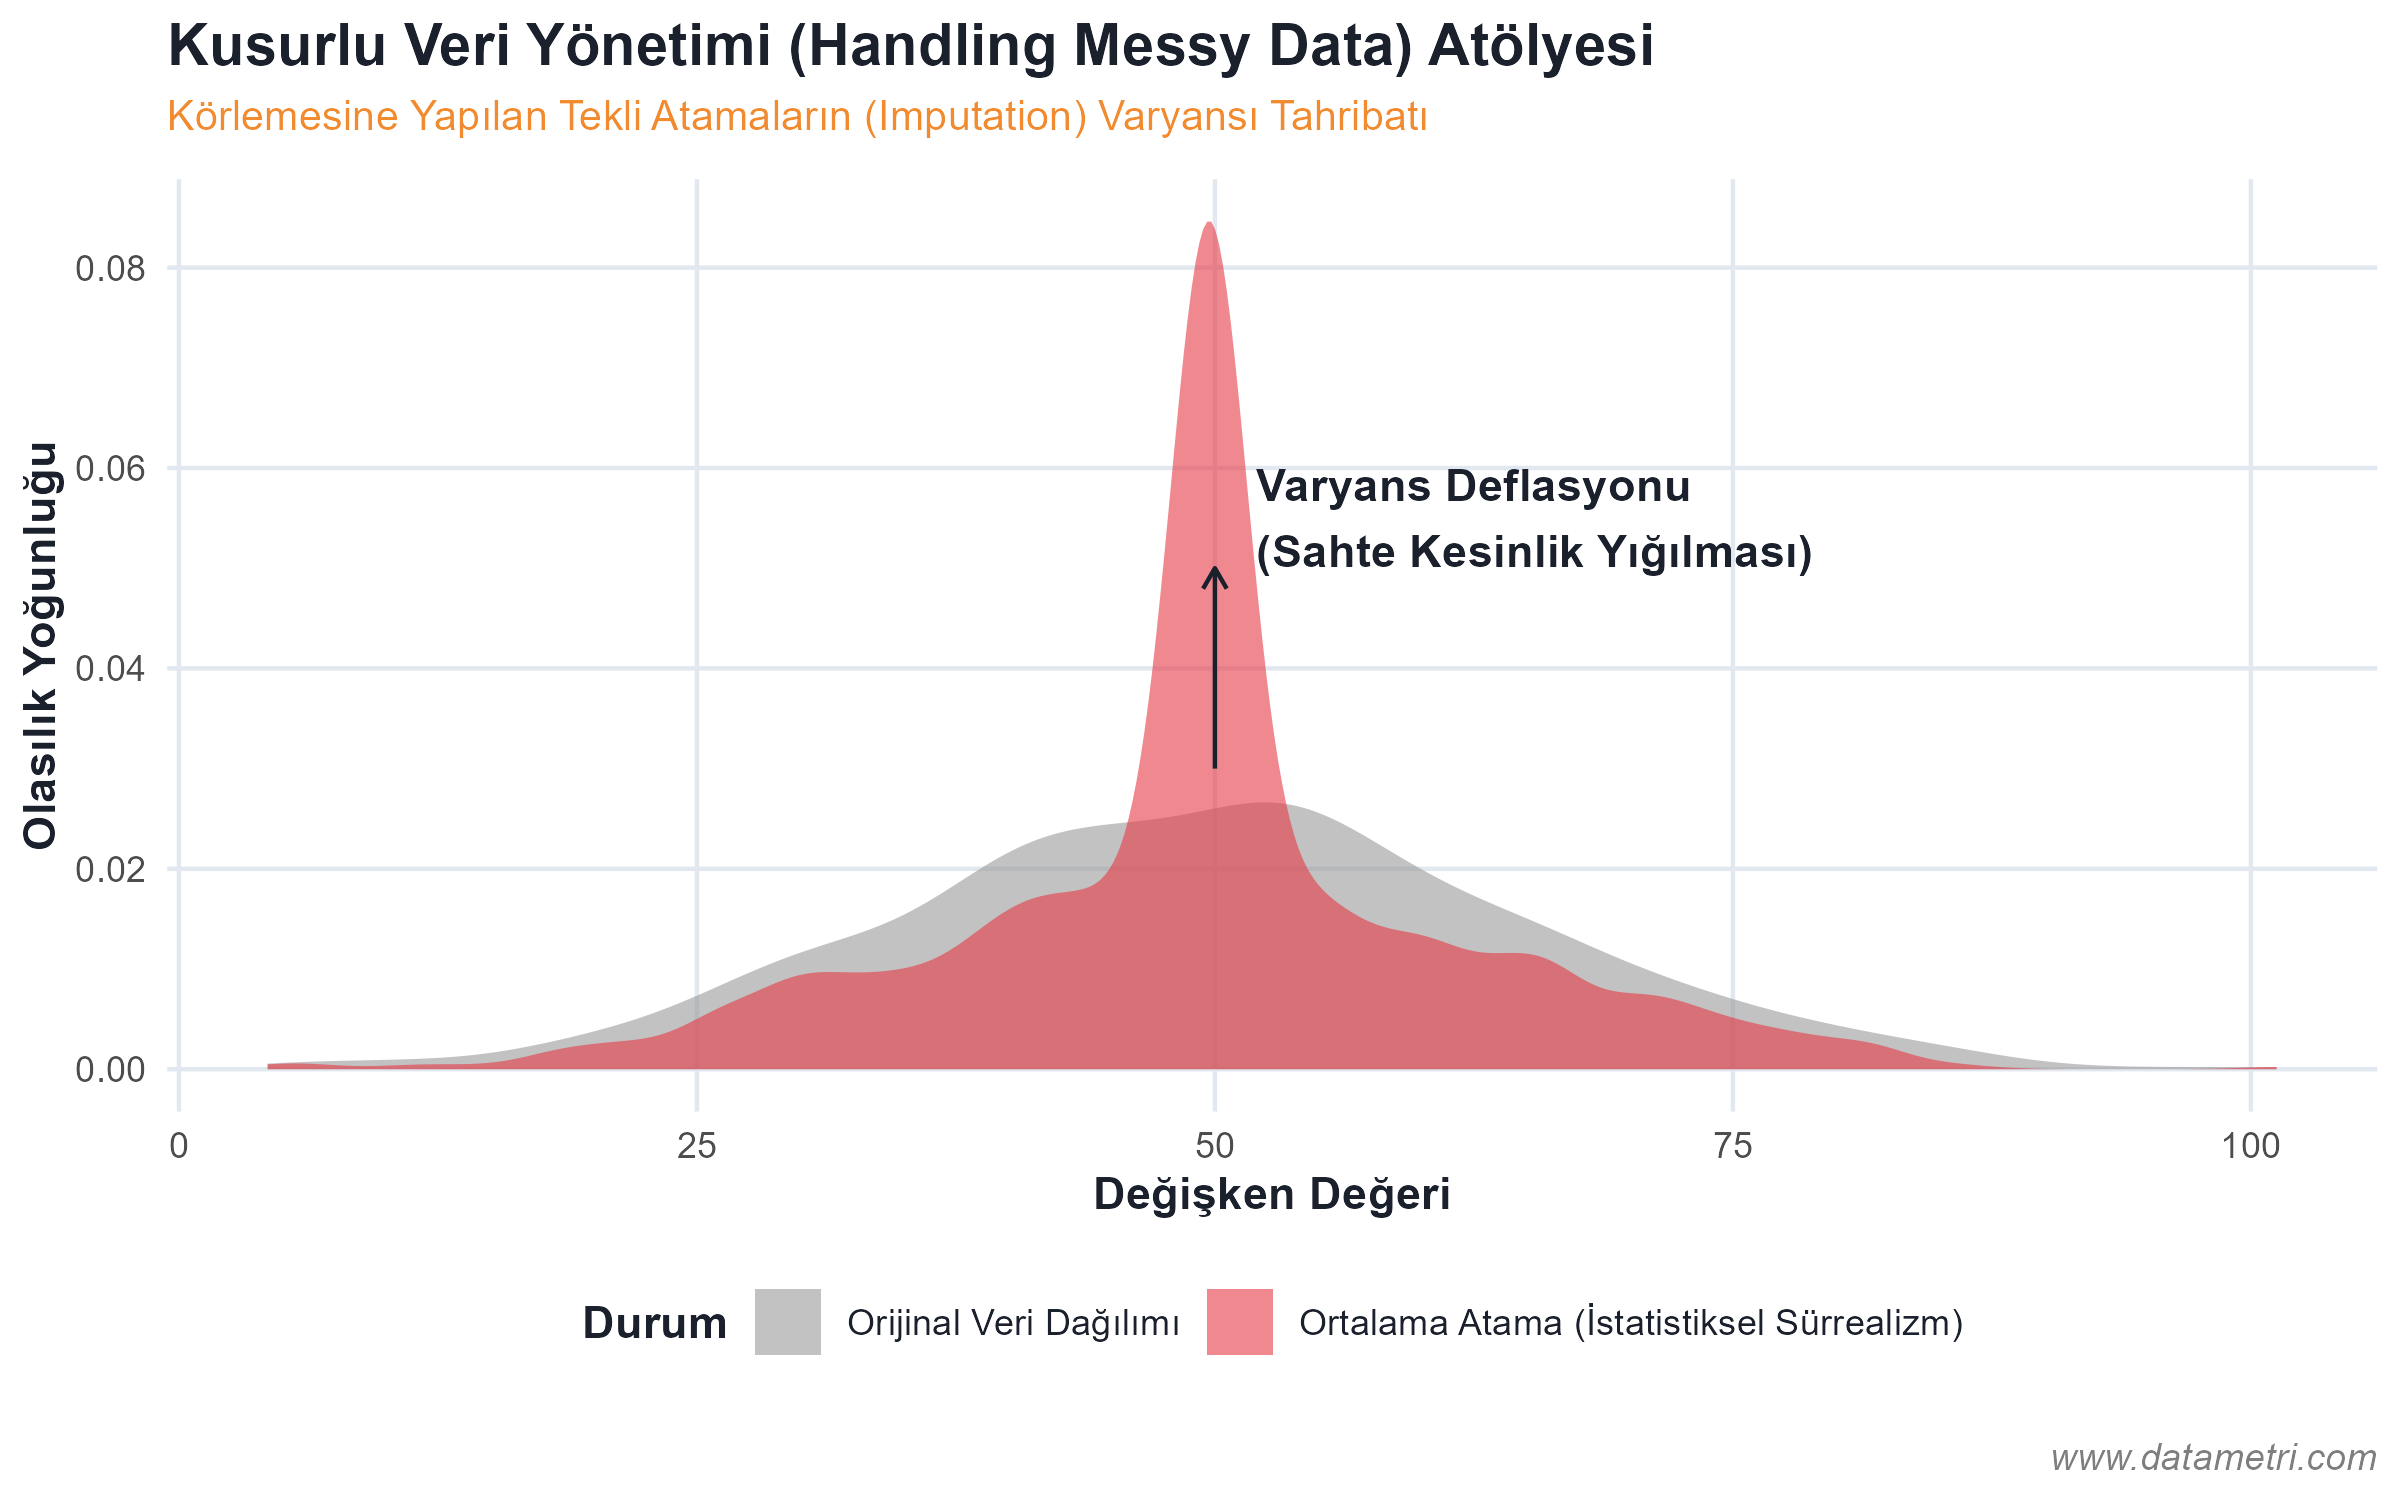
  • Confidence Intervals and Variance Estimation: The practice of incorporating statistical margins of error (Standard Error) into the decision mechanism, instead of treating Point Estimates in reports as absolute truths.
C-Level Data Literacy and Stochastic Decision Making
caption = 'www.datametri.com'
This program elevates boards of directors from the position of a passive consumer of reports and transforms them into an authority that audits the methodological validity of data and builds strategy on empirical evidence.
02
Statistical Skepticism and Falsification for Analysts
Simpson's Paradox Analyst Training

Datasets cannot produce decisions on their own. This is a technical methodology training specifically for analysts and market researchers, aiming to prevent the cognitive shortcuts (heuristics) the human brain uses to avoid complexity from reflecting on data analysis as "Systematic Error".

Training Curriculum and Academic Outcomes:
  • Central Tendency Fallacy: How the arithmetic mean creates a manipulative blindness in asymmetric data exhibiting a Power Law or Pareto distribution; the analytical value of variance, mode, and Outliers in data mining.
  • Simpson's Paradox and the Effect of Confounders: The mathematical proof of how positive correlations observed in sub-layers (Strata) turn into a negative trend illusion when the data is aggregated cumulatively.
  • Censored Data and Survivorship Bias: The ecological fallacies that will be created by analyzing failed cases that broke away from the research population (Attrited) or left the system through the remaining "successful" mass.
Statistical Skepticism and Simpson's Paradox
caption = 'www.datametri.com'
By breaking Confirmation Bias; it guides analysts toward the approach of a scientist who tests data according to Karl Popper's "Falsifiability" principle, rather than trying to prove their own preconceptions.
03
Psychology of Data Visualization and Cognitive Load Management
Data-Ink Ratio Data Design

Visualizing data is not an aesthetic design process; it is a cognitive engineering based on Gestalt psychology principles and Edward Tufte's "Data-Ink Ratio" axioms. An incorrectly coded graph destroys the epistemological transparency of even the most powerful econometric analysis.

Training Curriculum and Academic Outcomes:
  • Visual Manipulations (Chartjunk) and Distortion: The anatomy of false growth illusions created by not starting the Y-axis from zero (Truncated Graphs), 3D pie charts distorting spatial perception, or cumulative curves.
  • Isolation of Cognitive Clutter: Techniques for maximizing the data signal (Signal-to-Noise Ratio) by cleaning out unnecessary grid lines and data labels that overload the viewer's Working Memory.
Cognitive Load Management and Data Visualization
caption = 'www.datametri.com'
It stops your reporting from being charts that distort data with aesthetic concerns; and transforms them into epistemologically honest, manipulation-free scientific documents that accelerate decision mechanisms.
04
Applied Econometrics and Flawed Data Management Workshops (Handling Messy Data)
MICE Imputation Applied Workshop

Generic analysis trainings conducted with sterile datasets (dummy data) from the academic literature cannot be integrated into corporate problems. Datametri workshops are constructed within the framework of a Non-Disclosure Agreement (NDA) on the actual, missing, and noisy operational data arising from the institution's own ontological structure.

Training Curriculum and Academic Outcomes:
  • Missing Data Mechanisms (Ontology): How "Blind Mean / Regression Imputation" malpractices, executed without questioning the MCAR, MAR, or MNAR nature of missing data, kill the data's variance (Variance Deflation) and create spurious correlations.
  • Multiple Imputation Methods: Applied training on model-based imputation techniques like MICE (Multivariate Imputation by Chained Equations), which honestly add the statistical uncertainty created by missing values to the Standard Errors.
Applied Data Imputation and Econometrics Workshop
caption = 'www.datametri.com'
At the end of the workshop, departments gain not a theoretical certificate; but a methodological competency capable of correcting systematic errors (bias) in their own operational data.
05
Corporate Artificial Intelligence (AI/LLM) Methodology and Ethical Boundaries
AI Literacy RAG Architecture

Large Language Models (LLM) are not a deterministic consciousness; they are Stochastic Parrots that memorize patterns in training datasets. This training focuses on understanding how artificial intelligence replicates its epistemological limits and the structural biases (Algorithmic Bias) in corporate data, rather than what it "can do."

Training Curriculum and Academic Outcomes:
  • The Ontological Origin of Hallucination: Deciphering that artificial intelligence does not hallucinate; it actually reflects back to us with a logical language the "lies" in fictional training sets whose variance has been killed (illusion of homogeneity created) by blind "single imputation malpractices" (Statistical Surrealism).
  • Retrieval-Augmented Generation (RAG) and Vector Isolation: The theoretical foundation of how corporate data must be isolated with the RAG architecture to prevent models from detaching from empirical reality (Ground Truth).
Stochastic Nature of LLMs and RAG Architecture
caption = 'www.datametri.com'
It frees institutions from the illusion of technological determinism that "AI solves everything"; and transforms them into rational structures that can manage AI with its methodological limits and variance margins (error tolerance).

Transform Your Data Culture with Our Corporate Trainings

Explore our training programs to elevate your company's Data Literacy to academic standards, from the board of directors to your analyst teams.