Datametri Logo
01
Channel Attribution and Conversion Contribution Analysis (Markov Chain Attribution)
Markov Chain Removal Effect
"Which Channel Merely Sees the Conversion, and Which Truly Triggers It?"

Standard marketing reports typically rely on "Last Click" algorithms, and this deterministic limitation causes significant deviations in budget allocation. Datametri calculates the marginal mathematical contribution of each digital channel to the total conversion by analyzing the transition probabilities between channels using Markov Chain and Removal Effect algorithms.

Which Questions Does This Analysis Answer?
  • If I eliminate my advertising budget from which channel, will the largest negative variance (drop) in my total conversion volume statistically occur?
  • What is the true economic (ROI) value of the channels that provide an "assist" at the entrance of the conversion funnel but do not appear at the stage where the sale is closed (last touch)?
What Could Be the Added Value to Your Business?
  • Marketing Budget Optimization: Prevents regressive investment in channels with low impact coefficients in the purchasing journey, maximizing ROAS by directing the budget toward truly "catalyst" channels.
  • Channel Synergy Strategy: Models which touchpoint combinations persuade the customer to convert with a higher probability by discovering the stochastic synergy among channels.
Markov Chain Attribution Comparison
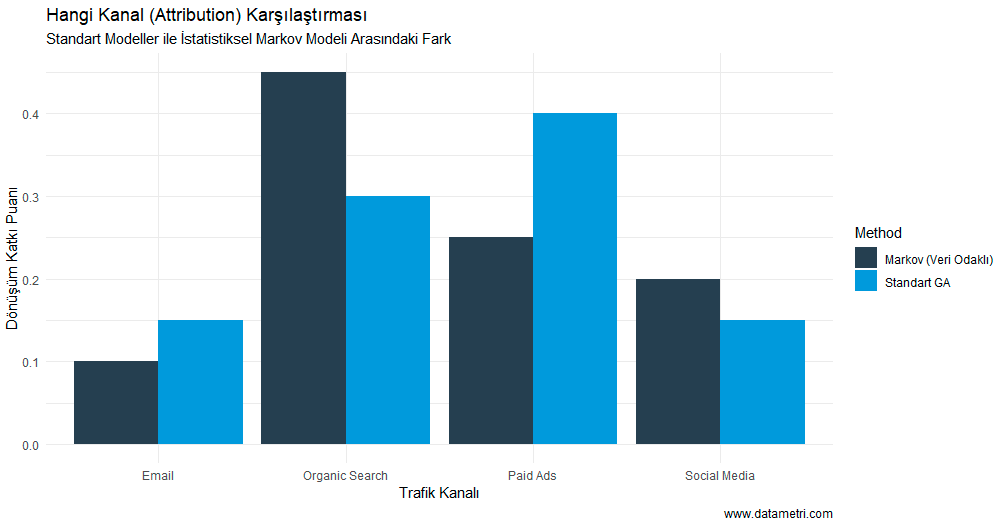
The graph clarifies the deviation between standard deterministic models (light blue) and the probabilistic Markov model (dark blue). Moving beyond the "Paid Search" channel, which is rewarded solely for taking the last click, the Markov model empirically documents the hidden power (Removal Effect) of "Organic" or "Display" channels that create trust and awareness at the beginning of the customer journey.
02
Web User Behavior Clustering (K-Means Clustering)
K-Means Algorithm Intent Segmentation
"Algorithmically Segment Your Visitors Based on Intent and Engagement Depth"

In the digital realm, demographic data and coarse session counts are insufficient for predicting intent. Datametri segments visitors behaviorally using the K-Means Clustering algorithm on raw data such as the time they spend on the site, page depth, scroll rates, and engagement events.

Which Questions Does This Analysis Answer?
  • What is the statistical volume variance between the audience with a "window-shopping" behavior on my site and the audience with a "high intent" to purchase?
  • Which of these obtained behavioral clusters constitute the most suitable investment profile for hyper-personalized remarketing strategies?
What Could Be the Added Value to Your Business?
  • Personalized Conversion Rate Optimization (CRO): Increases overall conversion rates by making dynamic interventions suited to the specific needs of each cluster (an article for the information seeker, an instant discount for those with purchasing intent).
  • Ad Budget Savings: Provides capital efficiency by focusing the retargeting budget exclusively on the group harboring "High Potential" (warm leads), rather than wasting it on the "Low Engagement" group.
Web Visitor Behavior Clustering Graph
The clusters on the scatter plot structure your website's user traffic on an "intent" basis. While the volume and centralization of the "High-Intent Buyers" cluster symbolize the commercial effectiveness of the site; an excess in the "Low Engagement" group indicates an anomaly in the user experience (UX) or the quality of the directed traffic.
03
Web Traffic and Conversion Forecast Analysis (ARIMA Forecasting)
Time-Series Forward Forecasting
"Forecast Future Traffic Volume and Conversion Capacity with Econometric Accuracy"

Web traffic exhibits a structural trend and a seasonal cycle. Datametri projects future visitor and transaction volumes with high statistical accuracy by processing historical GA4 session and conversion data through advanced time series models (ARIMA/SARIMA).

Which Questions Does This Analysis Answer?
  • With the projected digital marketing momentum, what traffic volume and indirect transaction volume should we expect in the coming quarter?
  • Are potential negative deviations in visitor trends a natural seasonal cycle of the market, or the beginning of a structural break in SEO/advertising performance?
What Could Be the Added Value to Your Business?
  • Capacity and Infrastructure Planning (Resource Allocation): Enables you to proactively synchronize server and personnel capacity by predicting the probable server load and customer support density during periodic campaign phases (e.g., Black Friday) in advance.
ARIMA Web Traffic Projection
The time series graph extends historical data into the future by filtering out its trend and noise. The blue main line (mean forecast) symbolizes the most probable stochastic scenario, while the shaded areas surrounding it represent the statistical margins of error (confidence intervals) of the forecast. The direction of the trend visually proves the sustainability of current digital strategies.
04
User Retention and Churn Analysis (UX Survival Analysis)
Kaplan-Meier UX Optimization
"At Which Stage of the Site and Due to Which Design Are Visitors Abandoning the System?"

By adapting the Survival Analysis method used in medical statistics to web session data, we model the probability of the user "surviving" (remaining active) on the site along the time axis. This methodology is an advanced UX analysis that proves not just the bounce rate, but which design variation (A/B) makes the user more resilient on the path to conversion.

Which Questions Does This Analysis Answer?
  • On average, at what second (hazard function) after entering the site do visitors decide to leave the page?
  • Which of the tested "Landing Page" designs is statistically more successful at drawing users deeper into the funnel?
What Could Be the Added Value to Your Business?
  • Scientific UX Decisions: Allows you to manage User Interface (UI) and Experience (UX) changes not merely based on "subjective aesthetic" preferences, but with concrete p-values and empirical evidence that maximize the visitor's probability of staying on the site (survival).
Kaplan-Meier Web Churn Curve
The Kaplan-Meier (KM) survival curve shows how the cumulative probability of the user remaining active in the system drops as the interaction time extends. The horizontal and vertical curve difference between two distinct design variants (Design A and B) statistically proves which interface architecture delays the speed of user churn.
05
User Conversion Propensity Classification (Propensity Modeling)
Purchase Probability Logistic Regression
"Score the Near-Term Purchasing Probability of Visitors with Machine Learning"

Based on raw web event data, we analyze the sequence of actions performed by the user, session frequency, and viewed categories using logistic regression-based machine learning models. This model calculates the "propensity to buy" of that anonymous visitor within the next 24-48 hours as a score between 0 and 100.

Which Questions Does This Analysis Answer?
  • To which of the hundreds of thousands of visitors on my site should I grant an "instant promotion/coupon" (nudging) to profitably secure the conversion rate?
  • Instead of distributing my Performance Marketing budget to broad audiences, can I channel it solely to segments with a "high propensity to convert" (propensity > 70%)?
What Could Be the Added Value to Your Business?
  • Dynamic Incentive Management (Smart Bidding): Prevents showing discounts and ads to users whose likelihood of purchasing is already very high or to those who won't buy no matter what (dead ends). Reduces the cost per acquisition (CPA) by focusing the budget only on the mid-to-high group that is "persuadable" with a minor financial incentive.
Conversion Propensity Score Distribution
This probability density graph shows the distribution of traffic on your website based on their "propensity to purchase" scores. The dark blue region approaching the right tail (high propensity) represents the warm audience closest to conversion and most receptive to intervention. This differentiation provides surgical precision in remarketing budget management.

Let's Optimize Your Digital Conversion Funnel

Contact us to identify hidden leakages in your marketing budget by processing your GA4 data stream and web traffic with machine learning models.