Datametri Logo
01
Predictive Demand and Inventory Optimization
Time-Series ARIMA / SARIMA
"Eliminate Excess Inventory Costs and Out-of-Stock Risks"

The path to operational excellence lies in knowing today "how much you will sell tomorrow". By utilizing time series analyses and machine learning algorithms, we forecast future demand volume based on your field sales data on a product and regional basis.

Which Questions Does This Analysis Answer?
  • Over the next 3 months, how much inventory of which product should I hold in which warehouse?
  • Is the increase in our sales a temporary fluctuation or a permanent growth trend?
Added Value to Your Business
  • Capital Efficiency: Frees up cash in your warehouse by reducing idle inventory by 20-30%.
  • Revenue Protection: Protects your market share by preventing the risk of "stockouts" for popular products.
Demand and Inventory Forecasting Model
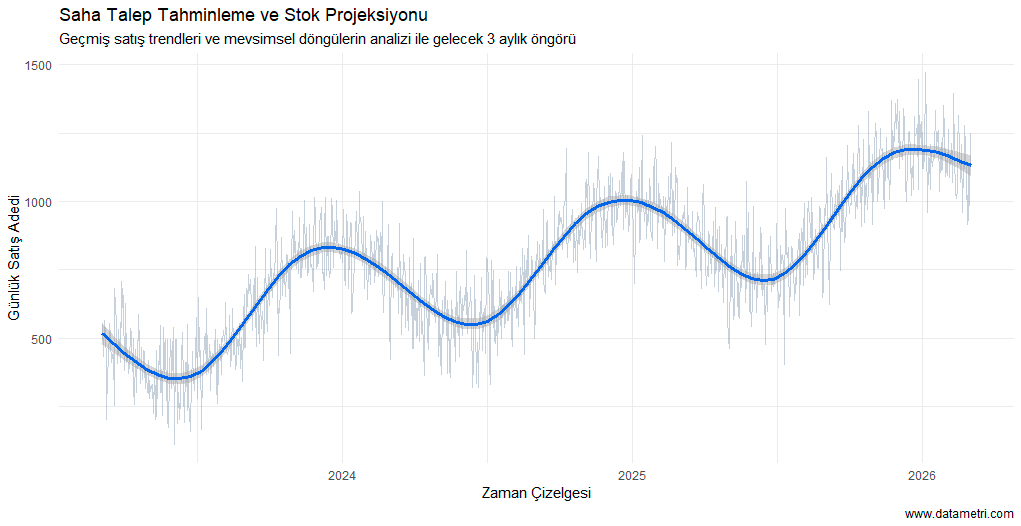
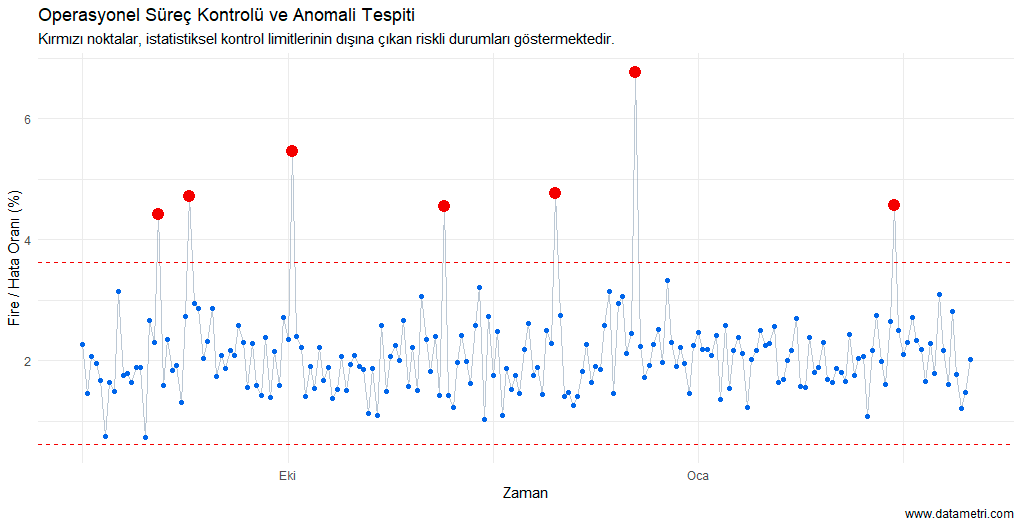
The gray lines in the chart represent daily field fluctuations, while the thick blue line represents the main trend and seasonal cycle filtered by the algorithm. This modeling mathematically determines when your inventory levels should be increased and when they should be reduced.
02
Route and Logistics Efficiency Analysis
Operations Research Linear Optimization
"Cover Efficiency, Not Just Kilometers"

Using the data of field teams or delivery vehicles; we develop routing algorithms that optimize constraints such as traffic, delivery windows, and vehicle capacity.

Which Questions Does This Analysis Answer?
  • How do I complete all deliveries in the shortest time with my current fleet?
  • On which routes do we have hidden time losses and unnecessary kilometers?
Added Value to Your Business
  • Cost Reduction: Provides 10-20% savings on fuel, maintenance, and depreciation costs.
  • Time Management: Adds operational agility by increasing the daily visit capacity of field personnel.
Route and Logistics Optimization Map
The flow between the center (warehouse) and the visit points on the map shows the "shortest and most efficient" route that minimizes distance and time. The sizes of the nodes symbolize the workload capacity at that point.
03
Field Personnel Performance Scoring
Integrated Performance Score Normalization
"Data-Driven Objective Performance Management"

We measure the success of field teams not merely by revenue; but by normalizing metrics such as visit frequency, route compliance, and sales conversion rate into an "Integrated Performance Score".

Which Questions Does This Analysis Answer?
  • Who is my personnel managing the operational processes with the highest discipline, not just those making the most sales?
  • Which of my personnel needs improvement in which area (persuasion skills, visit frequency, etc.)?
Added Value to Your Business
  • Fair Bonus System: Transforms performance management from subjective interpretations into a data-driven reward system.
Integrated Performance Score Chart
Each bar represents the net score of the personnel calculated according to all operational criteria. This provides an opportunity for fair comparison, free from regional difficulties.
04
Anomaly Detection and Operational Risk Analysis
Machine Learning Statistical Control
"Halt the Invisible Leaks in Your Processes"

We instantaneously detect sudden increases in waste on production lines or unusual delays in logistics processes using machine learning and report them as risk signals.

Which Questions Does This Analysis Answer?
  • Are the fluctuations in my processes a statistical coincidence or a risk requiring intervention?
  • What are the "hidden anomalies" undermining operational efficiency?
Added Value to Your Business
  • Proactive Intervention: Prevents operational downtime and avoids high-cost crises by detecting malfunctions or process deteriorations before they escalate.
Statistical Control Limits and Anomaly Detection
The red dots falling outside the statistical control limits indicate an issue (malfunction, waste, fraud risk) that needs to be investigated in the field.
05
Field Impact and Penetration Analysis (Geospatial)
Geospatial Data Analysis Heatmap Model
"Parcel the Market with Geographic Data"

By processing your field data based on coordinates; we merge customer density, competitor penetration, and accessibility layers on a map.

Which Questions Does This Analysis Answer?
  • Where are the potential customers unreached by our sales team clustering?
  • Where is the most profitable coordinate to open a new warehouse or branch?
Added Value to Your Business
  • Strategic Location Management: Reduces investment risk to zero by elevating regional investment decisions from "intuition" and grounding them in geographic reality.
Geospatial Data and Heatmap
The blue shading (heatmap) shows activity density, while the green and orange dots indicate market dominance and "opportunity zones" with growth potential.
06
Process Mining
Event Log Analysis Bottleneck Detection
"Scientifically Identify Bottlenecks in Your Workflows"

By tracking digital footprints, we prove through "Process Maps" exactly which steps slow down the process and where efficiency is lost.

Which Questions Does This Analysis Answer?
  • What are the differences between the ideal flow on paper and the actual flow in the field?
  • Where exactly is the point where the process gets most congested and creates a "waiting cost"?
Added Value to Your Business
  • Lean Management: Increases operational agility and optimizes resource utilization by identifying steps that do not generate added value.
Process Map and Bottleneck Analysis
Nodes represent operational steps, while red arrows indicate "Bottleneck" points (areas where transactions wait). Arrow thicknesses show the density of transaction volume.

Let's Initiate Your Operational Analysis

Share your field or logistics data with us; let's evaluate together how we can make your processes more efficient.