Datametri Logo
01
Heterogeneity and Sub-Group Analyses (Subgroup Forest Plot)
Random-Effects Subgroup Analysis
"Isolate the Source of Methodological Contradictions"

When calculating the overall effect of conflicting studies or studies conducted on different populations, we do not ignore methodological differences. We stratify studies based on predetermined categorical moderators (e.g., study design).

Which Questions Does This Analysis Answer?
  • When independent studies are statistically synthesized, what is the overall net direction of the effect?
  • Do the selected sub-groups (e.g., study design, applied dose, clinical stage) create a significant difference (heterogeneity) on the effectiveness of the intervention?
Added Value to Your Research

Resolves the problem of "inconsistency" in the literature. Mathematically isolates the source of differences without falling into the "comparing apples and oranges" fallacy frequently criticized by reviewers.

Sub-Group Analysis Forest Plot
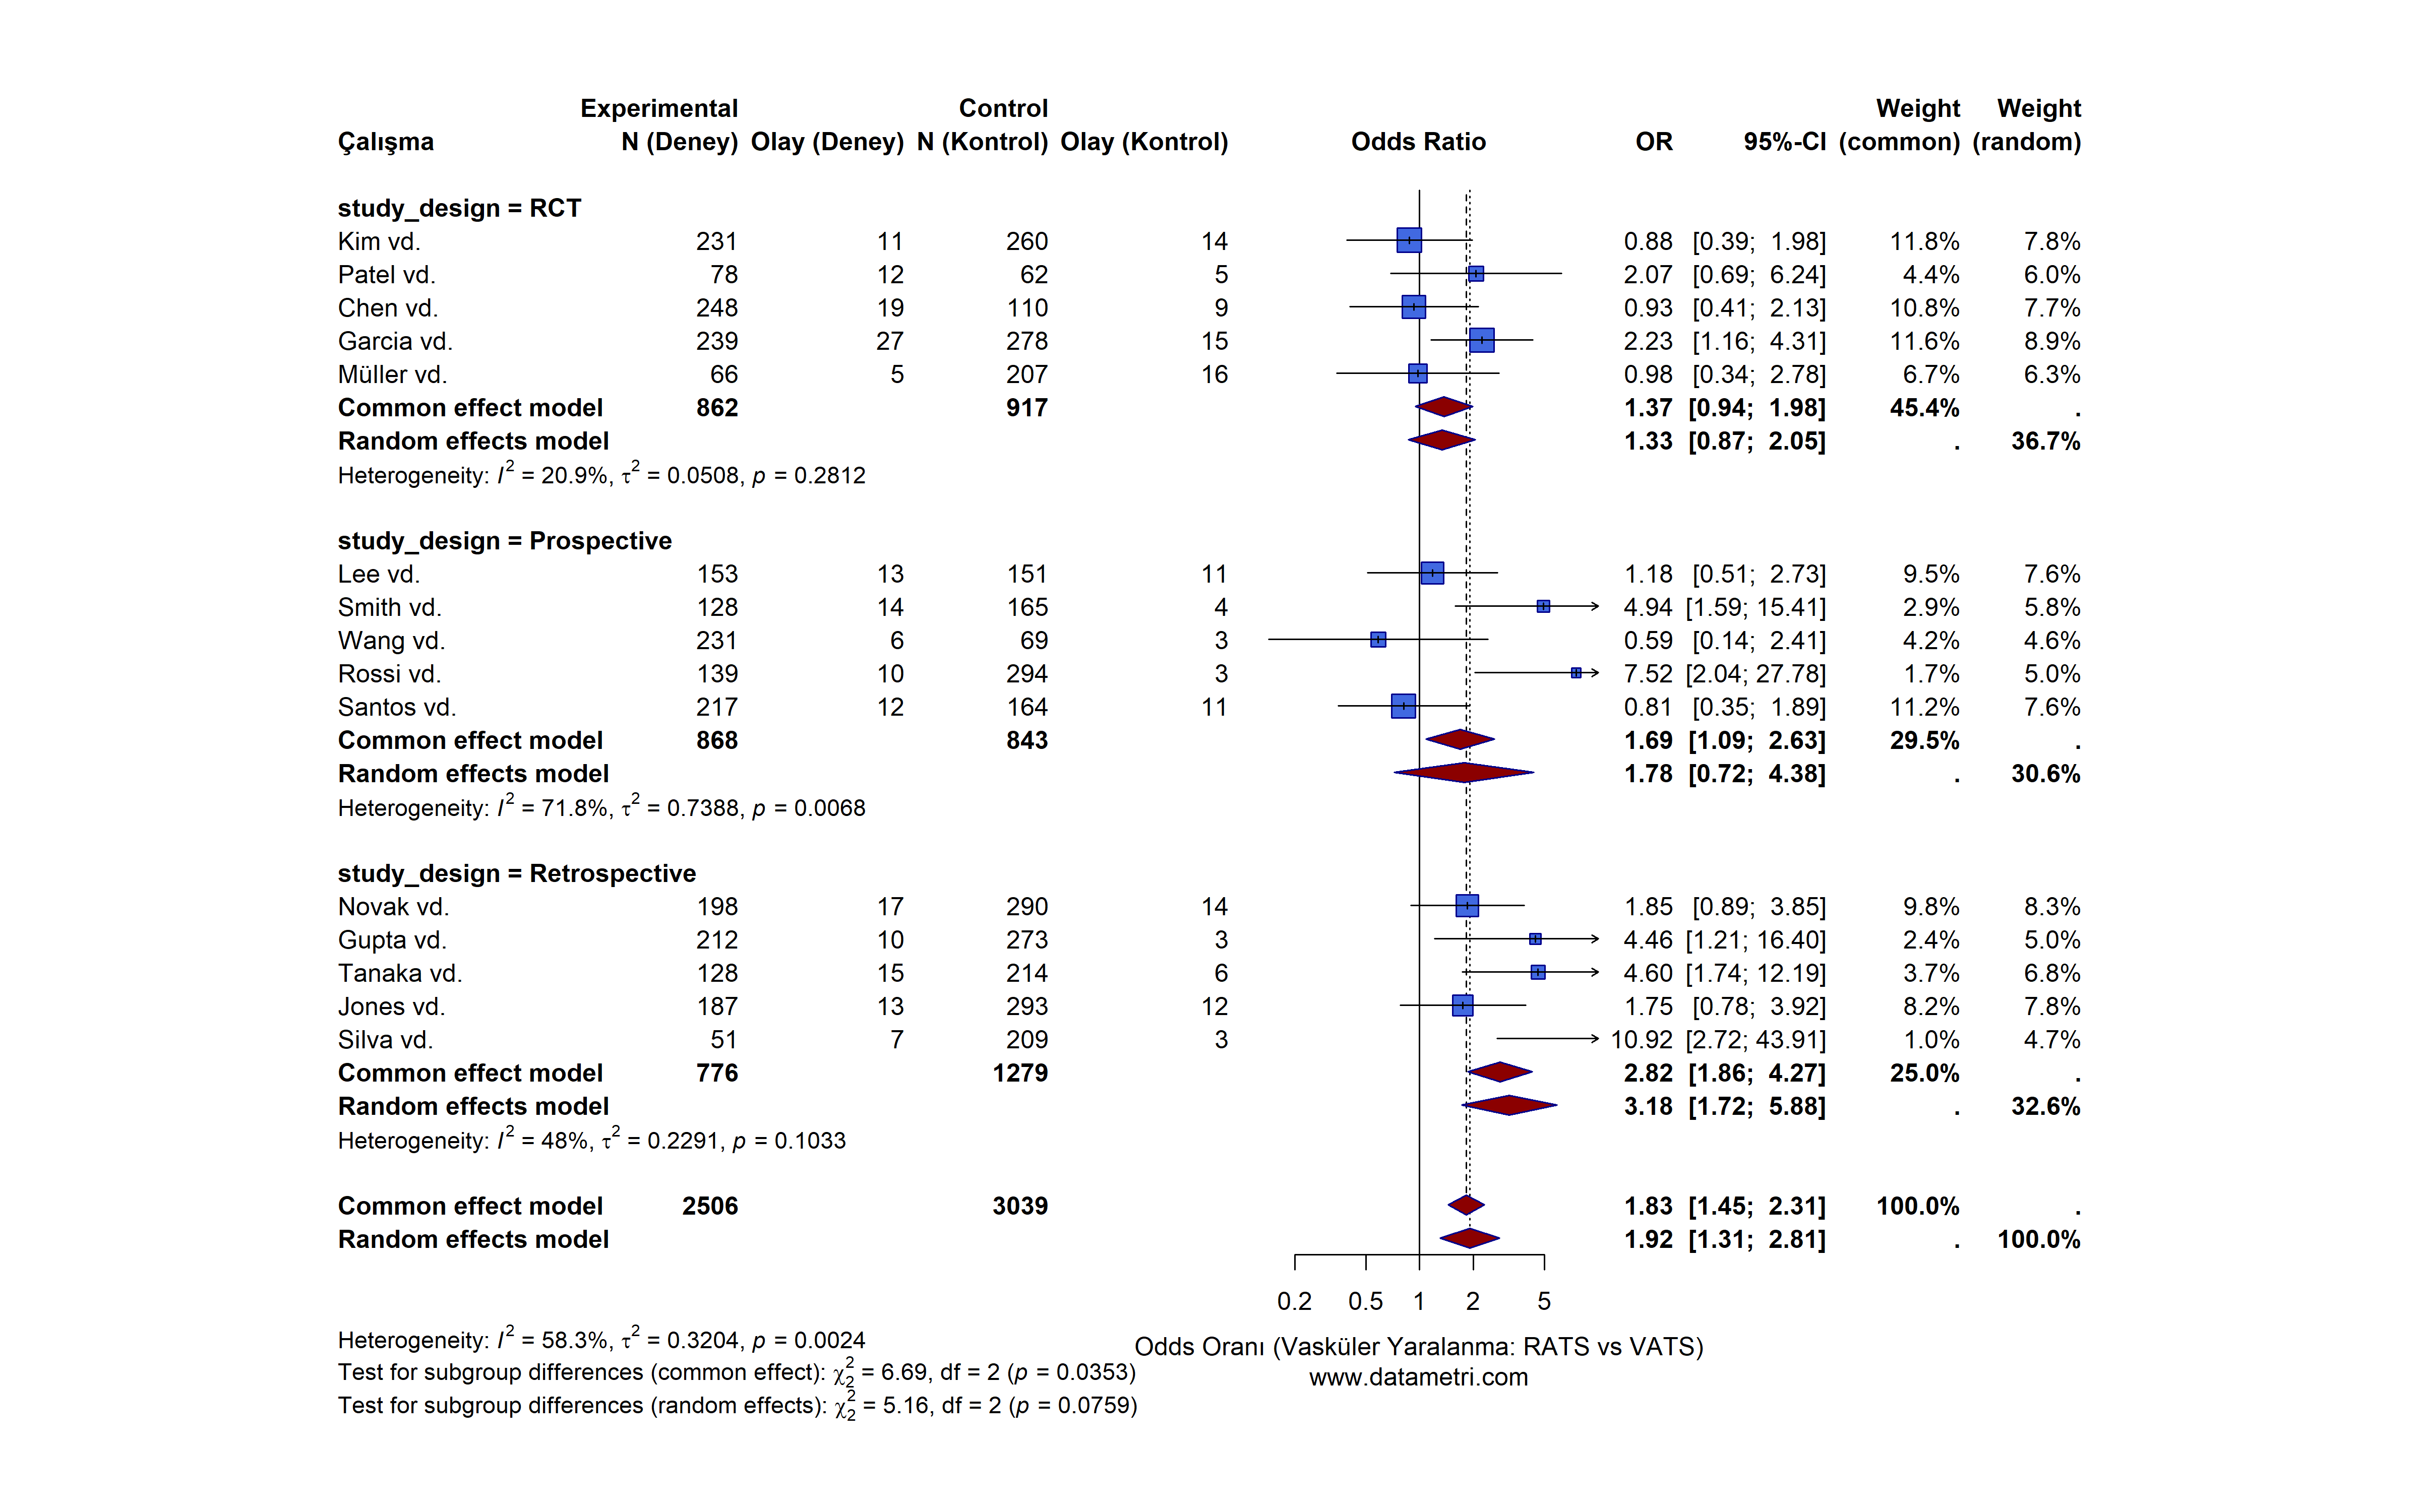
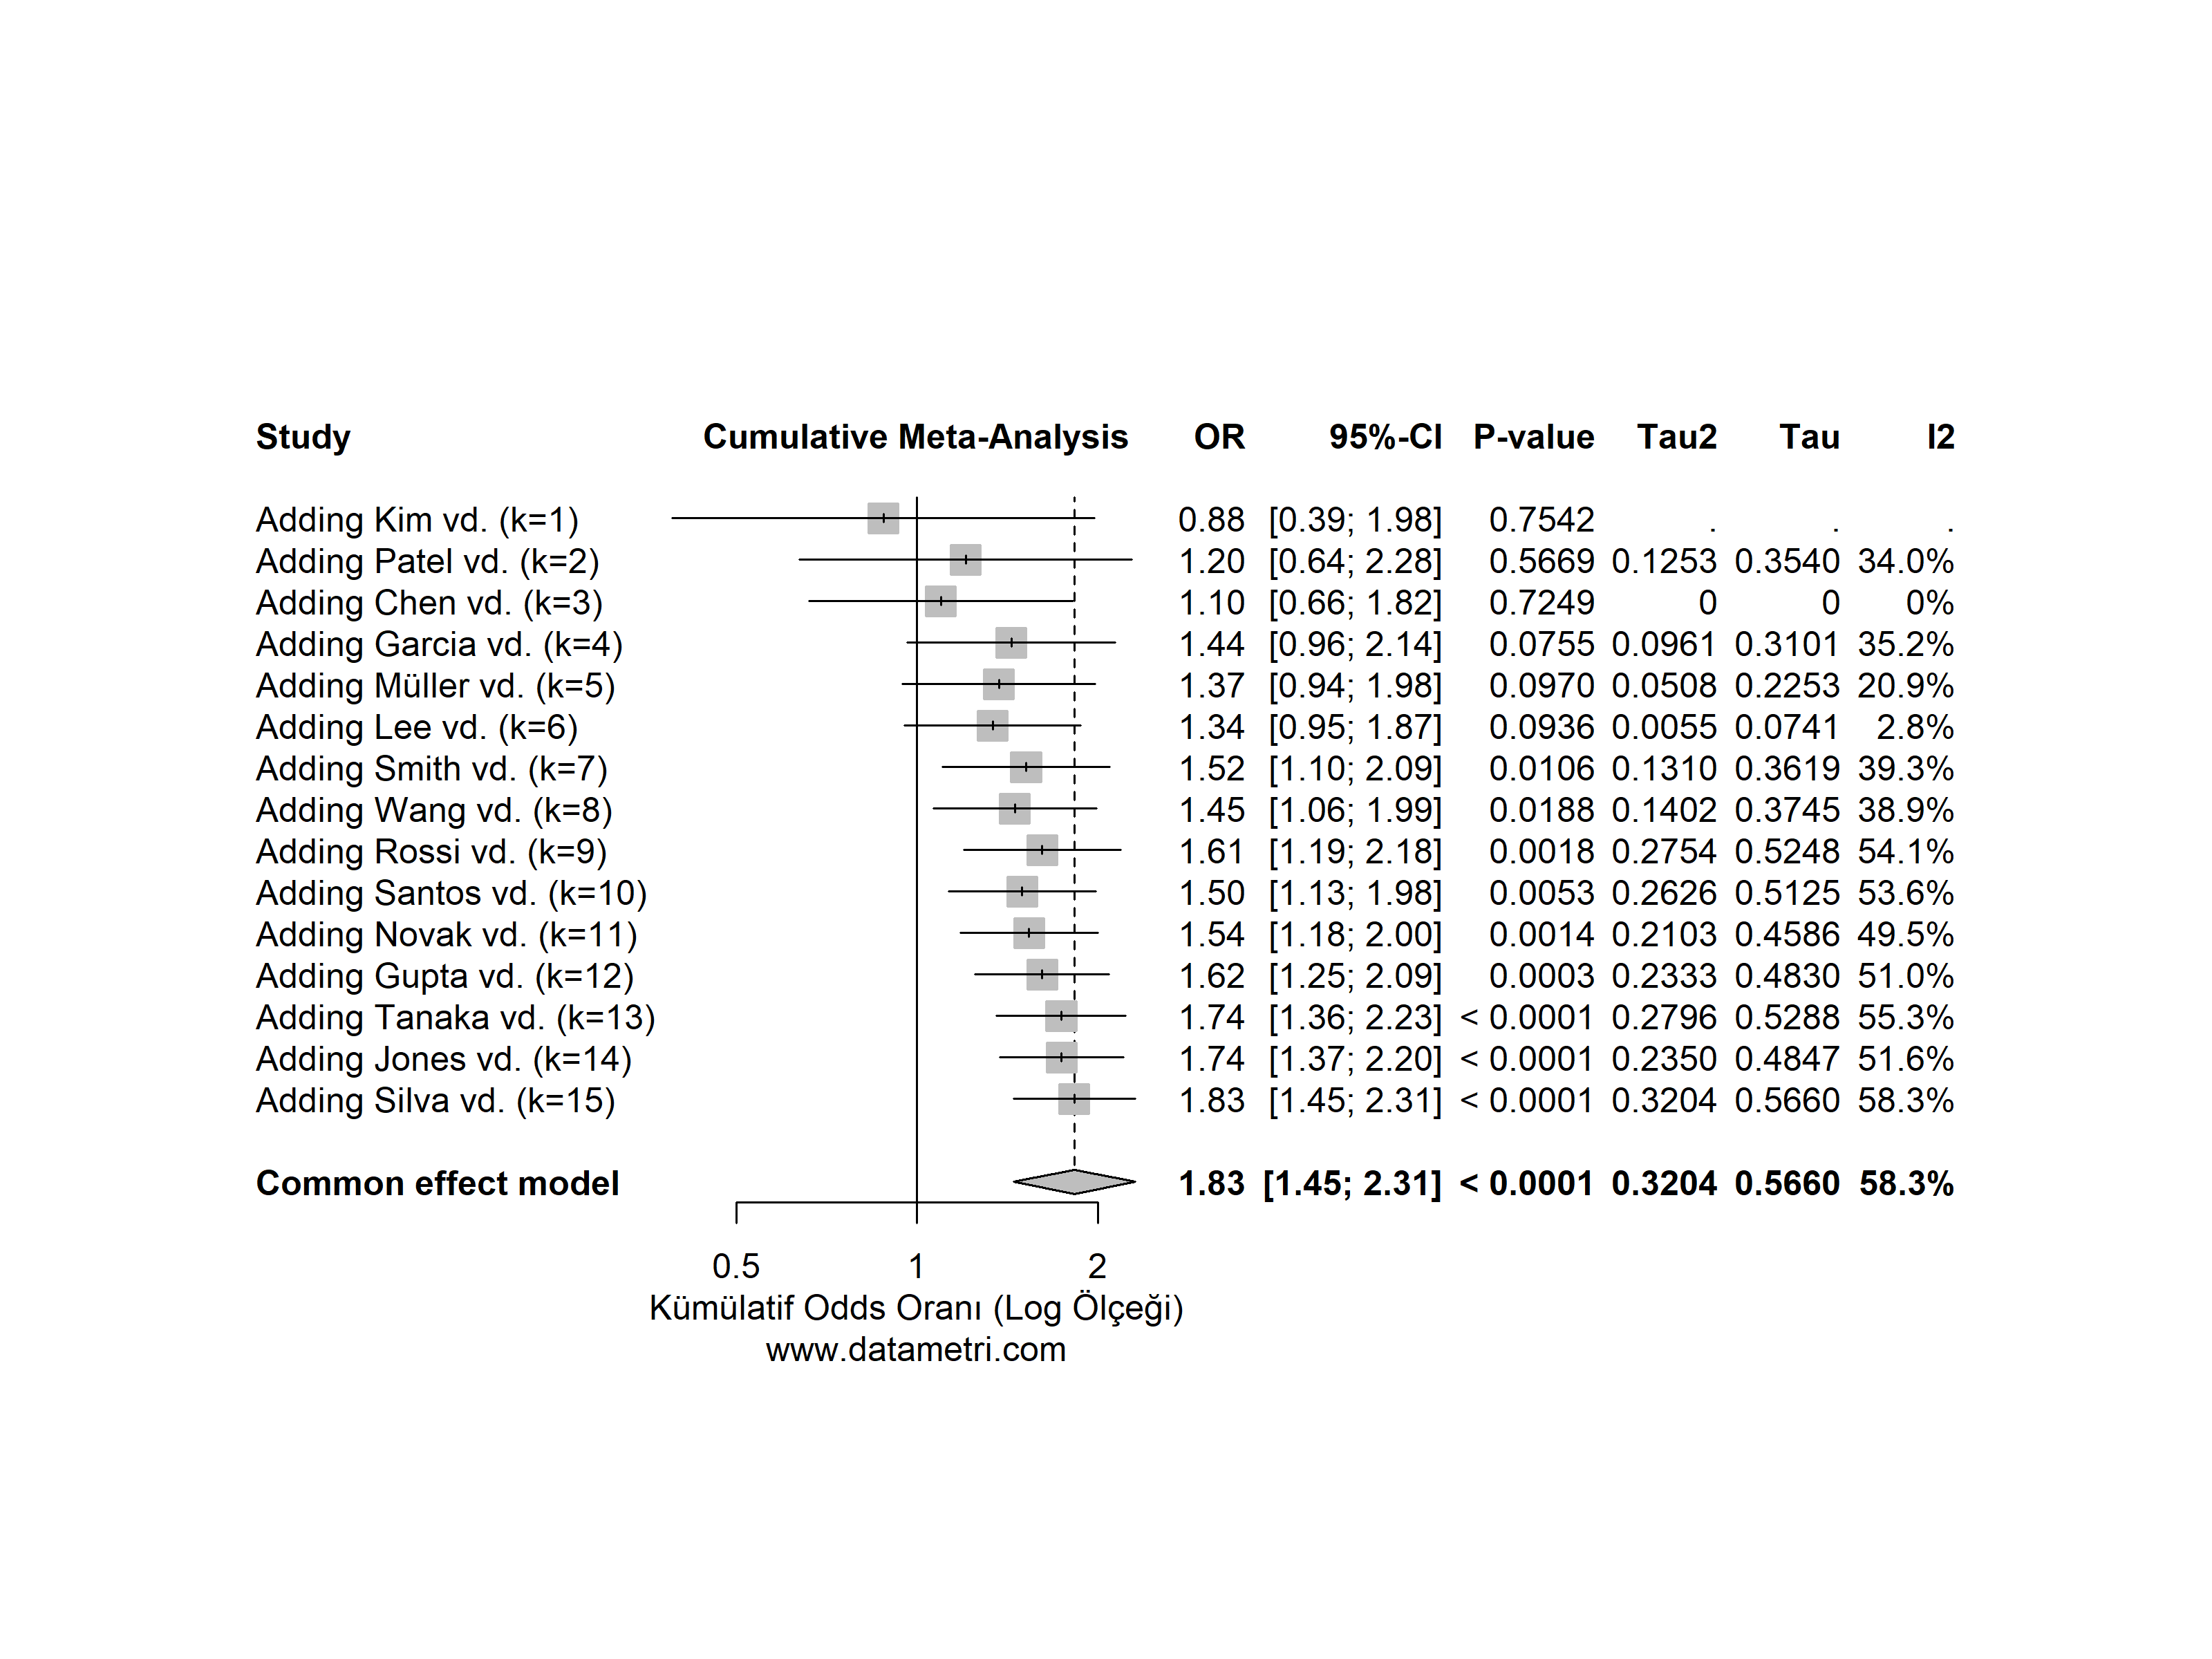
This Forest Plot synthesizes the effect sizes (Odds Ratio - OR) and 95% Confidence Intervals of the studies via a Random-Effects Model. The analysis stratifies the studies according to "Study Design". The dark red diamonds indicate the pooled net effect size.
02
Publication Bias Audit (Contour-Enhanced Funnel Plot)
Trim and Fill Egger's Test
"Reflect the Shadow of Unpublished Literature Onto Your Model"

The tendency for only statistically significant (p < .05) results to be published in the literature is the greatest methodological vulnerability of meta-analyses. We overcome this "file drawer problem" using advanced diagnostics.

Which Questions Does This Analysis Answer?
  • Is there a systematic publication bias present in the selected literature network?
  • If unpublished negative/insignificant studies were also present in the literature, in what direction and by how much would the pooled effect size we calculated change?
Added Value to Your Research

Proves that the meta-analysis findings are not the result of a biased literature review. High-impact factor (Q1) journals will not review any meta-analysis where publication bias has not been tested and adjusted.

Contour-Enhanced Funnel Plot
This Contour-Enhanced Funnel Plot is a publication bias audit combined with Egger's Regression Test. The blue dots represent published studies, while the salmon-colored triangles represent the "missing" studies simulated by the Trim and Fill algorithm and imputed into the model.
03
Outlier and Influence Diagnostics (Baujat Plot)
Leave-One-Out Outlier Detection
"Statistically Expose Studies Disrupting the Overall Equilibrium"

In cases of high heterogeneity (I² > 50%), we do not perform random exclusions to determine which study disrupts the equilibrium of the overall model; instead, we apply algorithmic influence analyses.

Which Questions Does This Analysis Answer?
  • Which specific studies manipulate the direction of the overall outcome (pooled estimate)?
  • How does the overall effect change when studies that are the source of excessively high heterogeneity are removed (Leave-One-Out analysis)?
Added Value to Your Research

Equips the researcher with the power and scientific justification to state "it was proven to be statistically anomalous" rather than saying "it didn't fit my narrative" when excluding a study from the literature.

Baujat Diagnostic Plot
The Baujat Diagnostic Plot shows the position of each study within the meta-analysis ecosystem. The horizontal axis determines the study's deviating influence on the overall result; the vertical axis determines its contribution to heterogeneity. The orange points moving away to the upper right quadrant (outliers) threaten the model's reliability.
04
Meta-Regression and Cumulative Meta-Analysis Models
Meta-Regression Cumulative Forest
"Model the Literature as a Dynamic Process"

Meta-Regression: Is an advanced analysis model that tests how the effect size changes depending on a continuous variable (e.g., age, dose, publication year) rather than a categorical one.

Cumulative Meta-Analysis: Puts an end to literature debates by presenting, from a historical perspective, when scientific evidence became "definitive" on the timeline.

Which Questions Does This Analysis Answer?
  • Does the effectiveness of the applied treatment systematically decrease as the mean age (continuous variable) of patients increases?
  • After the study conducted in which year did the evidence on a specific topic in the scientific world finally reach a point of statistical saturation?
Added Value to Your Research

Adds a causal depth to the meta-analysis. In research grant applications, it is a strategic necessity to prove to funding agencies (TÜBİTAK, NIH) the answer to the question, "Why do we need / not need to conduct this study?".

Meta-Regression Bubble Plot
Bubble Plot: Displays the relationship between effect size and a continuous moderator (e.g., publication year). The red regression line and its surrounding confidence interval denote the direction and trend of the moderating effect.
Cumulative Forest Plot
Cumulative Forest Plot: Incorporates studies into the model one by one, sorted by publication year. The narrowing of the diamond width (shrinking of the confidence interval) proves how prediction precision increases over time.
05
Multivariate Causal Networks (Structural Equation Modeling)
SEM / MSEM / RI-CLPM Causal Networks

Modern scientific research has reached a complexity where multidimensional phenomena such as human behavior, clinical pathologies, or organizational dynamics can no longer be explained by one-way, linear, and isolated variable pairs. International peer-reviewed journals in the Q1 segment and top-tier funding boards (TÜBİTAK, NIH, Horizon Europe) now demand going beyond the shallow question of "Which variables are correlated with each other?".

A. Full Structural Equation Modeling (Full SEM): Mediation Mechanisms

The traditional Baron and Kenny stepwise regression method resolves multiple paths independently of each other, increasing the Type I error rate. Datametri's Full Structural Model simultaneously resolves the entire causal network in a single variance-covariance matrix.

B. Multilevel SEM (MSEM) and RI-CLPM (Reciprocal Causality)

Applying standard regression to hierarchical data creates an "Ecological Fallacy." MSEM mathematically separates individual and group-level error margins. The RI-CLPM model, on the other hand, proves "Pure Causal Inference" by eliminating trait-like stable properties among individuals in longitudinal data.

Full Structural Equation Modeling and Mediation Effect
The statistical significance of the Mediation effect was tested with confidence intervals obtained by resampling the dataset thousands of times (Bootstrap resampling).
RI-CLPM Reciprocal Causality
The RI-CLPM diagram isolates individuals' invariant personality traits (Random Intercepts) in time series data and parameterizes the cross-lagged paths between variables in an error-free causality loop.

Let's Transform Literature into a Scientific Evidence Set

Share the quantitative studies you've compiled and your analysis protocol with us; let's collaboratively prepare your research into a high-impact Meta-Analysis article compliant with PRISMA standards.