Datametri Logo
01
Parametric Comparative Analyses (Parametric Tests)
Parametric Tests ANOVA & t-test
"Models with the Highest Population Representativeness"

These are the tests with the highest statistical power, used when your data meets the assumptions of normal distribution and homogeneity of variance.

  • Independent Samples t-Test: Analyzes the mean differences between two independent groups (e.g., Experimental and Control groups). The magnitude of the difference is standardized using Cohen’s d coefficient.
  • Paired Samples t-Test: Measures the effectiveness of an intervention by comparing measurements of the same group at different times (e.g., Pre-test and Post-test).
  • One-Way ANOVA: Examines differences among three or more groups holistically (Omnibus test). When a significant inter-group difference is detected, Post-Hoc corrections (Tukey, Scheffe, Bonferroni) are applied to determine which groups originate the difference. The explanatory power of the analysis is reported with Eta-Squared (η²).
Parametric Comparative Analyses Graph
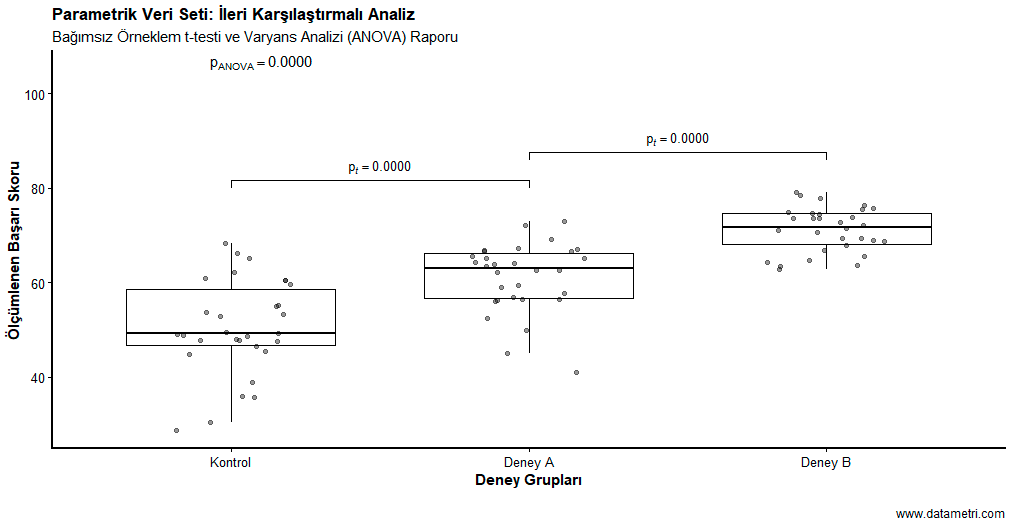
Drawing strength from the distributional properties of the data (mean, variance), parametric analyses determine with high robustness whether the difference between groups is statistically significant across the population.
02
Non-Parametric Alternatives (Distribution-Free Tests)
Non-Parametric Distribution-Free
"Robust Solutions Against Assumption Violations"

These are statistical tests that produce results using rank values instead of the true mean of the data in situations where assumptions are violated (e.g., extreme deviation from normality, presence of outliers, or small sample size).

  • Mann-Whitney U Test: The non-parametric equivalent of the independent t-test; it compares the median values of the groups.
  • Wilcoxon Signed-Rank Test: The counterpart to the paired t-test; analyzes changes in repeated measures without disrupting the data structure.
  • Kruskal-Wallis H Test: An alternative to ANOVA, it produces distribution-free results in comparisons of three or more groups.
Non-Parametric Tests Distribution Graph
By reducing the risk of making a Type I error to zero in excessively skewed datasets, non-parametric tests form your most reliable academic line of defense in instances of assumption violations.
03
Relational and Model-Oriented Analyses
Correlation Regression
"Measure Interaction and Predictive Power Among Variables"

Going beyond group comparisons, these are analyses that determine the extent to which continuous variables explain each other (explained variance) and the direction of the relationship between them.

  • Correlation Analysis: Determines the strength and direction of the relationship between variables using Pearson r (Parametric) or Spearman ρ (Non-Parametric) coefficients.
  • Simple and Multiple Linear Regression: Measures the predictive power of independent variables on the dependent variable. The statistical success of the model and its population representation power are academically reported with Adjusted R-Squared values.
Linear Regression and Correlation Analysis
The regression model measures the effect of one or more predictors on the dependent variable while holding other variables constant (ceteris paribus). The "Line of Best Fit" on the scatter plot visually proves the direction of the relationship.

Let's Test Your Hypotheses on a Scientific Foundation

Share your research hypotheses and data with us; let's collaboratively plan the testing and reporting processes that will maximize the academic value of your study.