Datametri Logo
01
Missing Data Matrix and Missingness Pattern Analysis
Missing Data MCAR / MAR / MNAR
"Analyze the Hidden Patterns Behind Missing Data"

The presence of missing values (observations) in an academic dataset not only reduces the sample size of the study but also carries a severe risk of bias depending on the missing data mechanism. The statistical determination of whether the missingness in the data is random (e.g., via Little's MCAR test) is crucial for determining the multiple imputation strategy to be applied.

Which Questions Does This Analysis Answer?
  • If row-wise deletion (Listwise Deletion) is resorted to, does the remaining "complete-case" set meet the minimum n number required by the statistical power analysis?
  • For variables where the missing rate exceeds critical thresholds, which of the variance-preserving algorithms—Multiple Imputation or FIML—should be preferred?
  • Are the missing data clustering in a specific income group or demographic stratum, thereby systematically manipulating the results (selection bias)?
What Could Be the Added Value to Your Research?
  • Prevention of Selection Bias: Missing data management preserves the "representativeness" of the research. We eliminate the criticism of selection bias, which is the most frequent reason for rejection by peer-reviewers in the international academic publishing process, right from the start by scientifically reporting the missing data mechanisms (MCAR, MAR).
Missing Data Matrix Visualization
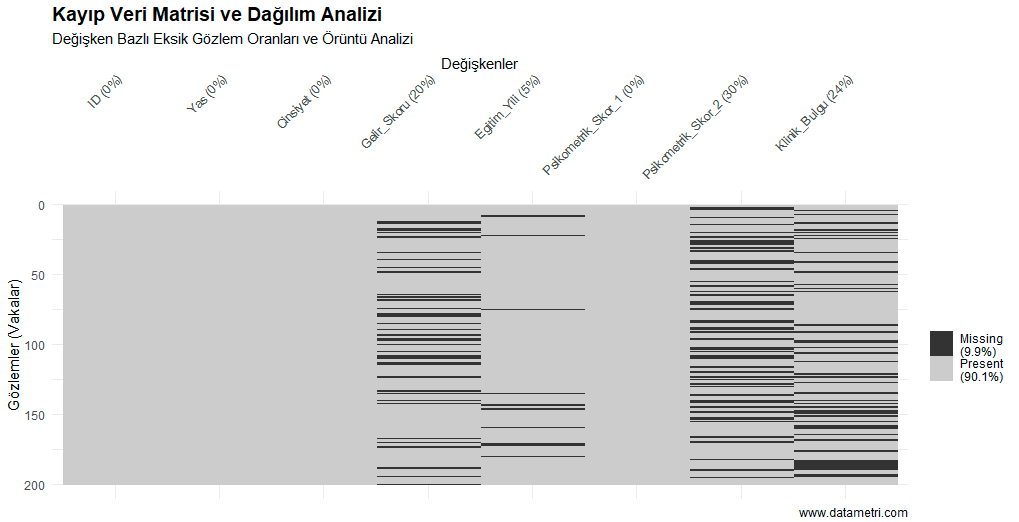
This matrix, generated by an R function (e.g., mice::md.pattern), represents observations (cases) on the vertical axis and variables on the horizontal axis. Black blocks symbolize missing data, while gray areas represent present data, visualizing whether the missingness is random or bound to a structural pattern (MCAR vs. MNAR).
02
Outlier Analysis: Methodological Refinement and Model Robustness
Mahalanobis Distance Multivariate Analysis
"Ensure the Reliability of Your Statistical Models by Managing Extreme Deviations"

During the statistical analysis process, outliers are observations that display a radical deviation from the central tendency of the sample. The detection of these values is not merely a data cleaning operation; it is a shield protecting the Statistical Robustness and External Validity of parametric research. Moving beyond univariate Z-scores, we detect hidden anomalies in multidimensional space using the Mahalanobis Distance.

Which Questions Does This Analysis Answer?
  • Which are the influential cases (leverage effect) that artificially distort regression coefficients or variance structure?
  • Is the assumption of Multivariate Normality violated due to the presence of these outliers?
  • The exclusion or limiting (winsorizing) of which cases from the dataset will increase the model's predictive power?
What Could Be the Added Value to Your Research?
  • Prevention of Estimation Bias: Ensures coefficients reflect the true relationship by eliminating the "leverage effect" (Cook's distance) created by outliers in OLS (Ordinary Least Squares) models.
  • Type I and Type II Error Risk Control: Preserves the sensitivity of the tests by preventing the inflation of the standard error; allowing you to defend the generalizability of the findings to the population with scientific authority.
Mahalanobis Distance Multivariate Outlier Analysis
The graph illustrates how far observation units deviate from the multivariate mean centroid. The red dots that cross the critical threshold (p < 0.001) are outlier cases that disrupt the variance-covariance structure of the model in a multidimensional combination, even if they appear normal individually.
03
Data Transformation and Normalization
Box-Cox Transformation Standardization
"Adapt Your Asymmetric Data to Parametric Statistical Standards"

The vast majority of parametric statistical tests (t-test, ANOVA, OLS Regression) demand as a minimum prerequisite that variables exhibit a Normal Distribution. Data transformation procedures render skewed data symmetrical while minimizing the model's standard error of estimate by fixing the variance of error terms (variance stabilization).

Which Questions Does This Analysis Answer?
  • With which mathematical transformation (Logarithmic, Square Root, Box-Cox) should variables exhibiting a right or left skewed distribution be made symmetrical?
  • How can independent variables with different units of measurement (e.g., age and income) be integrated into the same regression model?
What Could Be the Added Value to Your Research?
  • Variance Stabilization (Homoscedasticity): Validates the confidence intervals of the model by fulfilling the fundamental assumptions of parametric tests.
  • Coefficient Interpretability: Enables the determination of the relative importance of variables by rendering the beta coefficients of data on different scales comparable to one another through standardization (Z-score).
04
Feature Engineering and Data Recoding
Feature Engineering Dummy Coding
"Transform Raw Data into a Testable Analytical Architecture"

This is the phase of transforming raw data into an algorithmic "analytical architecture" capable of statistically testing hypotheses. An improperly coded dataset cannot be processed by machine learning or regression algorithms.

What is Done Within the Scope of This Analysis?
  • Negatively worded items in psychometric scales (reverse coding) are statistically inverted so as not to distort the total score calculation.
  • Continuous/quantitative variables (e.g., BMI score) are categorized (binning) according to theoretical necessities.
What Could Be the Added Value to Your Research?
  • Construct Validity: After verifying internal consistency (Cronbach's Alpha) and conducting Exploratory Factor Analysis (EFA), it transforms the relevant items into a single structural latent construct by mathematically combining them.
  • Dummy Coding Integration: Enables qualitative data to be processed parametrically by quantitative algorithms by converting nominal data (e.g., Blood Type) into reference categories.

Let's Prepare Your Data for the Analysis Stage

Contact us to optimize the missing values, outlying observations, and skewness in your dataset (Imputation, Normalization) in accordance with scientific literature.