Datametri Logo
01
Association Rules Analysis
Apriori Algorithm Cross-Sell Optimization
"Model Hidden Associations Between Products on a Statistical Scale"

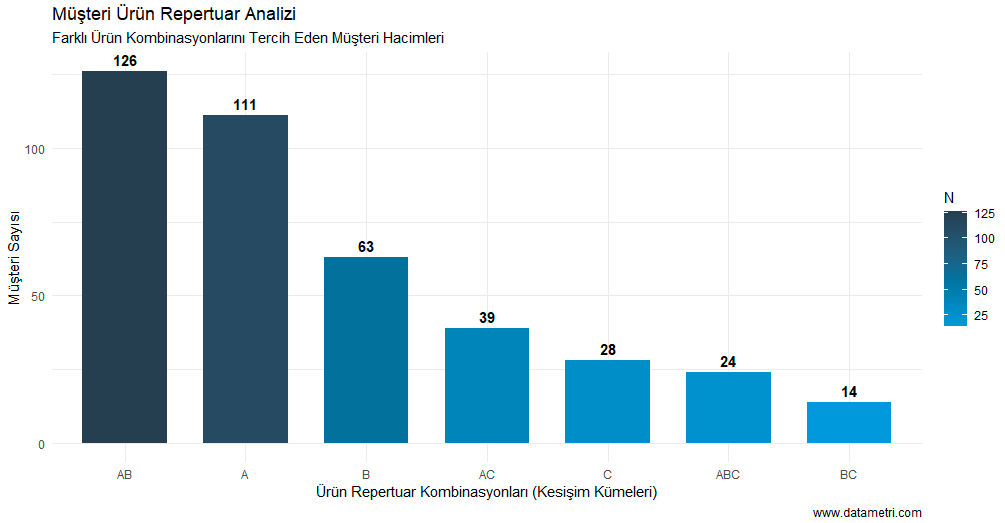
Based on the Apriori Algorithm, this analysis simultaneously scans product combinations within market basket data to reveal non-random purchasing associations. Supported by parametric calculations (Support, Confidence, Lift), this model provides a scientific foundation for cross-sell and campaign setups.

Which Questions Does This Analysis Answer?
  • Which complementary product is mathematically most likely to be added to the basket by a customer purchasing a specific core product?
  • Among the relationships between product combinations, which are coincidental (spurious), and which represent a strong behavioral pattern (Lift > 1)?
What Could Be the Added Value to Your Business?
  • Inventory and Shelf Optimization: Minimizes sales losses by enabling simultaneous stock management of products consumed together with a high correlation (complementary goods).
  • Marginal Campaign Strategy: Instead of offering discounts on products already purchased together by the consumer (high correlation), it supports protecting your profit margin by bundling "triggering" products with those having low correlation but high potential.
Association Rules Correlation Heatmap
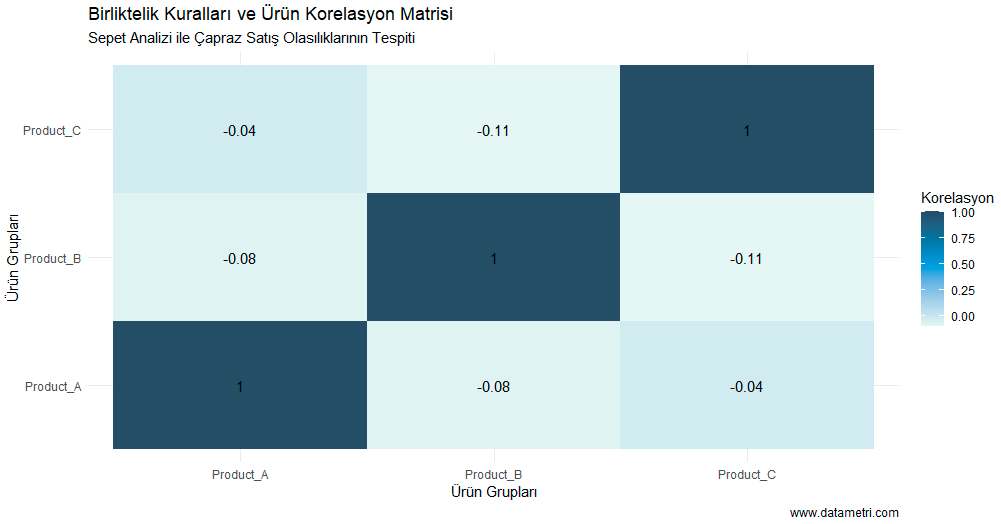
The color intensity and Pearson coefficients in the correlation heatmap quantitatively represent the strength of the linear relationship between products. As the coefficient approaches +1.00 (dark blue areas), it empirically proves that the sale of one product statistically triggers the other at a significant level.
02
Customer Product Repertoire Analysis
Product Portfolio Analytics Co-Consumption
"Analyze Category Transitions and Portfolio Overlaps of Customer Segments"

Instead of analyzing consumer behavior unidimensionally, we holistically model the "product sets" (Product Repertoire) owned by customers. This methodology reveals with scientific data whether the products in your portfolio compete against each other (cannibalization) or complement each other (co-consumption).

Which Questions Does This Analysis Answer?
  • Is our consumer base predominantly loyal to a single service category (single-buyer), or does it possess a broad product repertoire (multi-buyer)?
  • Does a new product launch organically grow our market share (halo effect), or does it merely cannibalize the sales volume of our existing flagship products?
What Could Be the Added Value to Your Business?
  • Strategic Market Expansion (Cross-sell): Enables you to develop empirical product recommendations that will increase the "share of wallet" by identifying the missing link in the customer's current repertoire structure.
Customer Product Repertoire Hierarchy
The graph hierarchically ranks the product clusters observed in consumers' baskets according to their statistical frequencies. The column exhibiting the highest aggregation (e.g., Combination AB) reflects the core behavioral axis in your business's market penetration.
03
Decision Trees and Classification
Machine Learning (Classification) Decision Rule Extraction
"Reduce Operational Data to Rule-Based Decision Mechanisms (Heuristics)"

We model the operational factors affecting targeted dependent variables, such as customer churn or risk classification, in a hierarchical decision tree format. This approach transforms complex data matrices into deterministic "If-Then" rules that operations teams can apply directly.

Which Questions Does This Analysis Answer?
  • Which independent variable (primary node) with the highest variance triggers the customer churn scenario?
  • What are the statistically common and decisive operational features of users exhibiting a high loyalty profile?
What Could Be the Added Value to Your Business?
  • Algorithmic Process Automation: Confers operational agility by establishing concrete rules derived from data (e.g., If Support Ticket Count > X, then Risk = High) instead of relying on managerial assumptions.
Classification and Decision Tree Model
The decision tree model splits the dataset into sub-branches, starting with the variable having the highest information gain (Gini impurity). The color coding of the nodes visually depicts the classification's confidence interval and risk probability.
04
Big Data Clustering Analysis
K-Means / PCA Unsupervised Learning
"Discover Latent Behavioral Segments (Constructs) within the Dataset"

Analyzing your consumer base based solely on predetermined (a priori) demographic categories leads to overlooking the dynamic structure of the market. By reducing the data dimensionality with PCA (Principal Component Analysis) and applying K-Means algorithms, the "natural and hidden clusters" (unsupervised clustering) within the dataset itself are revealed on a scientific plane.

Which Questions Does This Analysis Answer?
  • Which hidden niche profiles exist within our customer database that are homogenous internally (intra-class) yet entirely distinct behaviorally from one another (inter-class)?
  • How can we optimize our marketing resource allocation according to the specific behavioral characteristics of each algorithmically determined cluster?
What Could Be the Added Value to Your Business?
  • Hyper-Personalization: Maximizes Conversion Rates and ROAS through strategies tailored to the empirical nature of each cluster, assimilating mass marketing approaches.
Big Data Clustering Analysis Graph
The clustering graph reflects the two-dimensional projection of n-dimensional customer data via Principal Components (PCA). Each colored data cloud represents a mathematically overlapping consumer profile (persona); the inter-cluster distance represents the behavioral deviation variance of these profiles.
05
Advanced Time Series Forecasting (ARIMA)
Time-Series Analysis Statistical Forecasting
"Generate Macro-Level Future Projections with Your Operational and Sales Data"

Historical periods within the corporate data pool form a rich foundation for modeling future cycles and trends. Utilizing Autoregressive Integrated Moving Average (ARIMA / SARIMA) models, Datametri filters out the noise inherent in the data to provide deterministic forecasts with high statistical reliability.

Which Questions Does This Analysis Answer?
  • Within what confidence interval will our operational workload or overall demand volume navigate in the upcoming three quarters?
  • Do the changes observed in our sales metrics reflect a structural growth trend or a periodic seasonality effect?
What Could Be the Added Value to Your Business?
  • Optimal Resource Allocation: Secures efficiency by integrating personnel, inventory, and production planning into empirical confidence intervals rather than subjective expectations.
ARIMA Demand Forecasting Model
The time-series plot shows the future period projections calculated by passing past cycles through an analytical filter. The blue reference line represents the predicted mean forecast, while the shaded areas surrounding it depict the statistical deviation (variance) margins.
06
Customer Loyalty Duration (Survival Analysis / Kaplan-Meier)
Kaplan-Meier Survival Analysis
"Model the Churn Risk Across a Multivariate Time Axis"

Rather than evaluating customer churn as a singular, static rate, we analyze it as a longitudinal time process. With Survival Analytics, we model a customer's probability of remaining active in the corporate ecosystem and the hazard factors shortening this duration on an empirical plane.

Which Questions Does This Analysis Answer?
  • What is the level of loyalty decay rate (retention decay) observed as time (t) progresses among our organization's various customer cohorts?
  • Do operational service models (e.g., Premium vs. Standard) differentiate customer survival time in a statistically significant manner?
What Could Be the Added Value to Your Business?
  • Proactive Recovery Architecture: Enables the design of corporate intervention (retention action) plans during periods when the statistical hazard function peaks, by analyzing the customer base before it becomes entirely passive.
Kaplan-Meier Survival Curve
The Kaplan-Meier (KM) estimation curve models the change in the cumulative survival probability (P(T > t)) over time. Sudden and steep drop points on the curve symbolize critical operational bottlenecks where customer churn events are statistically concentrated within the system.
07
Corporate Ecosystem and Network Analysis
Graph Theory Node and Network Analytics
"Determine the Connection Density (Network Centrality) Among Operational Actors"

Big data clusters consist not only of singular variables (nodes) but also of structural interactions (edges) among these variables. Grounded in the principles of Graph Theory, this analytical model topologically maps the flow of information and payload within corporate supply chains, dealer networks, or product interactions.

Which Questions Does This Analysis Answer?
  • Within our supply or operational network, which are the high-centrality nodes that control the total network flow and carry the risk of becoming potential bottlenecks?
  • At what contagion rate and route does a localized failure or supply shock impact the remainder of the network?
What Could Be the Added Value to Your Business?
  • Systemic Resilience: Fosters risk assimilation by preemptively modeling operational disruptions (domino effect) that might occur in units bearing a high connection density and critical threshold value.
Ecosystem and Network Analysis Graph
The Network graph topologically displays the interaction frequency among operational nodes. Large-diameter actors (hub nodes) where numerous vectors (edges) converge represent the key operational assets carrying the "payload and information" of that ecosystem.
08
Anomaly and Risky Transaction Analysis (Outlier Detection)
Statistical Process Control Anomaly Detection
"Statistically Isolate Abnormal Deviations (Anomalies) in the Operational Data Flow"

Fraud, data pollution, or systemic failures occurring within financial or operational processes can hide inside the standard variance of the main data mass. This methodology captures, with high algorithmic precision, the outliers situated at the furthest distance from the mean within a multivariate space, exceeding deterministic audit thresholds.

Which Questions Does This Analysis Answer?
  • Which actions within the daily transactional log do not conform to the statistical "Gaussian distribution" pattern and should be evaluated as a potential threat (risky)?
  • In which operational variable set (location, transaction time, amount) are systemic errors or suspicions of fraud predominantly concentrated?
What Could Be the Added Value to Your Business?
  • Early Risk Assimilation: Consolidates internal audit capacity in a data-driven manner by detecting erroneous (or manipulative) transactions before they reflect on the corporate system and financial balance sheet.
Anomaly and Risky Transaction Distribution
While the dense data cloud centered on the scatter plot expresses the standard operational flow; the markers thrown to the outer circle by exceeding the Mahalanobis distance (or z-score) thresholds clearly depict "anomalous" (outlier) transactions outside mathematical normality.

Let's Consolidate Your Big Data Architecture Together

Contact us to integrate the hidden correlations and algorithmic values harbored within your datasets into your strategic decision-making mechanisms.