Datametri Logo
01
Relational Data Integration and Key Mapping
Relational Database Fuzzy Matching
"Consolidate Scattered Data Records into a Single Customer View"

Identifying the same customer or transaction registered with different identities (IDs) across different systems (ERP, CRM) is the foundation of integration. At Datametri, we consolidate these records using advanced matching algorithms (Fuzzy Matching), transforming your dataset into a single, analyzable structure.

Which Questions Does This Analysis Answer?
  • What statistical correlation exists between my financial data (ERP) and my customer behavior data (CRM)?
  • Are the service satisfaction levels of the customers in the segment generating the highest revenue (Monetary Value) quantitatively high, or do they carry a risk of churn?
What Could Be the Added Value to Your Business?
  • Single Customer View: Allows you to model your customer as a multidimensional profile by extracting them from the context of merely an "invoice" or "support ticket" and combining their behavioral and transactional footprints across all systems.
Data Merging and Key Mapping Map
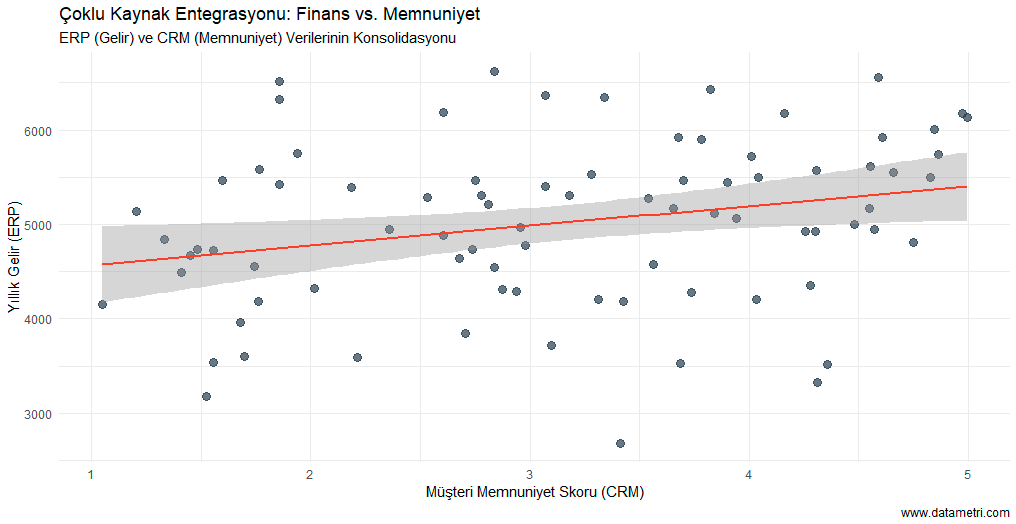
The Scatter Plot in the visual: illustrates the consolidation into a single matrix of annual revenue metrics pulled from ERP systems and customer satisfaction scores obtained from CRM systems.
  • The regression line with a positive slope verifies the statistical impact of satisfaction on revenue.
  • Strategic Finding: The primary finding is the simultaneous detection on the same econometric plane of the "developable potential" audience located in the bottom right quadrant (high satisfaction, low revenue) and the "VIPs with high churn risk" segment in the top left quadrant (low satisfaction, high revenue).
02
Cross-Platform Time Series Analysis
Time-Series Lag Effect
"Measure the Impact of Marketing Expenditures on Operational Outputs with Synchronized Models"

Measuring the effect of your ad spend on web traffic (GA4) and ultimately on physical sales or inventory consumption is only possible by integrating this data on a time series axis. Datametri sets up cross-platform analytics by including this operational "delay" (lag) effect as a parameter.

Which Questions Does This Analysis Answer?
  • How many days later (time-lag) does a periodic increase in the marketing budget reflect in sales figures?
  • How does the metric increase on digital platforms (traffic/impressions) statistically trigger physical store or logistics warehouse activity?
What Could Be the Added Value to Your Business?
  • Return on Investment (ROI) Optimization: Maximizes the Return on Investment (ROI) by directing budget allocation to the channels that provide the highest marginal utility and directly feed operational outputs.
Time-Based Cross-Source Analysis Graph
The normalized time-series analysis measures the synchronization asymmetry between marketing investments (Ads/Spend) and operational outputs (Sales).
  • The fact that the peaks in the graph do not perfectly overlap, and that the sales momentum follows the expenditures with a specific day delay, empirically documents the operational incubation period of the investment (Time-Lag Effect).
  • This cross-analysis allows you to mathematically calculate the speed at which marketing budgets turn into Cash Flow and the marginal delay margin.
03
Hybrid Data Merging (Structured & Unstructured)
NLP + Quantitative Hybrid Model
"Achieve Semantic Integrity with Quantitative Performance Indicators and Qualitative Data"

Detecting performance losses with purely quantitative metrics is insufficient; it is essential to support numerical data with semantic notes for root cause analysis. Datametri models the contextual patterns behind quantitative deviations by integrating deterministic data tables with text mining outputs.

Which Questions Does This Analysis Answer?
  • What are the primary operational complaint foci in regions exhibiting statistically poor performance?
  • To what extent do customers' unstructured feedback impede the attainment of quarterly financial targets as a metric?
What Could Be the Added Value to Your Business?
  • Root Cause Analysis: Rather than assuming the cause of numerical regression or deviations, it enables you to ground these variances on concrete operational arguments with qualitative data originating from the field.
Hybrid Data Merging Model
The hybrid boxplot synthesizes deterministic sales volumes (quantitative) with customer feedback themes processed by NLP algorithms (qualitative).
  • Transactions labeled "Fast Delivery" and "High Satisfaction" are located in the top quartiles with a narrow variance in sales volume (high stability).
  • Conversely, it is proven that regions labeled "Price Complaint" or "Logistics Issue" experience severe volatility and performance losses in sales. The Root Cause is no longer open to interpretation; it is a statistical reality.
04
Analytical Integration of OLAP Cubes
OLAP Cube Drill-down Analysis
"Create a Dynamic and Scalable Framework for Multidimensional Data Analysis"

We integrate data coming from heterogeneous sources across time, spatial, product, and audience dimensions. By constructing this multidimensional data cube architecture (OLAP), Datametri affords your organization the opportunity to examine data at any desired level of granularity (drill-down / roll-up).

Which Questions Does This Analysis Answer?
  • What is the integrated cost and return variance of a specific product category in a particular geographic location during a defined promotional period?
  • Due to the deficiency or impurity of which data source do the structural inconsistencies between our analytical models arise?
What Could Be the Added Value to Your Business?
  • Decision Support Agility: Enables you to dynamically generate the multidimensional and complex summaries (dashboards) required by top management from a single standardized data warehouse, without manual manipulation processes.
Multidimensional Data Cube (OLAP)
The 3D OLAP Cube (Scatter3D) model positions operational data in three different dimensions (Geography, Product Group, Total Cost) while integrating a fourth dimension, "Return Rate," via a color scale.
  • From a purely volumetric (cost) perspective, the Mediterranean Region - Electronics category (~400K TL) appears as the ecosystem's largest cost center; however, its return rate (11.0%) is at a relatively tolerable level.
  • Strategic Bottleneck: The genuine operational risk (red zone) is the Aegean Region - Electronics intersection, where both the cost is massive (~399K TL) and the return rate shoots to the top of the ecosystem (16.0%).
  • This 3D cross-analysis mathematically proves to managers that merely looking at revenue/cost figures would be misleading; the actual profitability leaks are hidden within multidimensional intersections.

Let's Consolidate Your Corporate Data Architecture

Let's evaluate with a methodological perspective how we can structure your ERP, CRM, and heterogeneous external datasets within the framework of an integrated analytical vision.